Fig. 1.
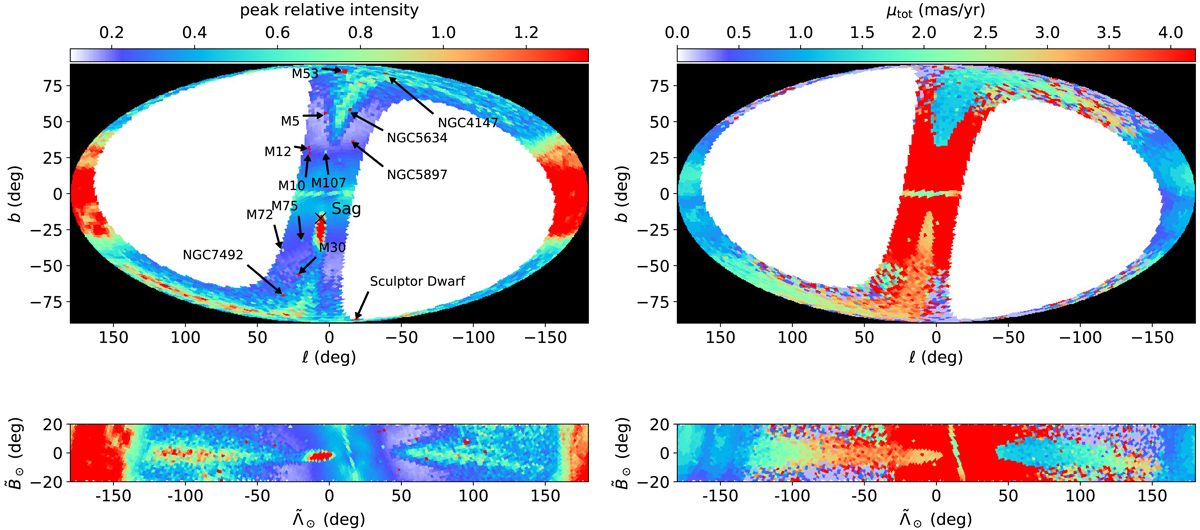
All-sky view of the Sgr stream with Gaia data in Galactic coordinates (top) and in the coordinates of the orbital plane of Sgr (bottom). Left: HEALpix map in the region of the Sgr stream (![]() ) colored according to the relative intensity of the most prominent peak detected in the corresponding HEALpix. Known objects such as globular clusters and dwarf galaxies show high relative intensities in their corresponding HEALpix and are marked with arrows. The location of the Sgr dwarf is shown with a black cross; its position was taken from Karachentsev et al. 2004. Right: same as left but colored as a function of the total proper motion μtot. In all panels, the trace of the Sgr stream is clearly observed in an almost full circle on the sky, with the leading arm at positive Galactic latitude b (positive
) colored according to the relative intensity of the most prominent peak detected in the corresponding HEALpix. Known objects such as globular clusters and dwarf galaxies show high relative intensities in their corresponding HEALpix and are marked with arrows. The location of the Sgr dwarf is shown with a black cross; its position was taken from Karachentsev et al. 2004. Right: same as left but colored as a function of the total proper motion μtot. In all panels, the trace of the Sgr stream is clearly observed in an almost full circle on the sky, with the leading arm at positive Galactic latitude b (positive ![]() ) and the trailing arm at negative b (negative
) and the trailing arm at negative b (negative ![]() ).
).
Current usage metrics show cumulative count of Article Views (full-text article views including HTML views, PDF and ePub downloads, according to the available data) and Abstracts Views on Vision4Press platform.
Data correspond to usage on the plateform after 2015. The current usage metrics is available 48-96 hours after online publication and is updated daily on week days.
Initial download of the metrics may take a while.