Fig. 3
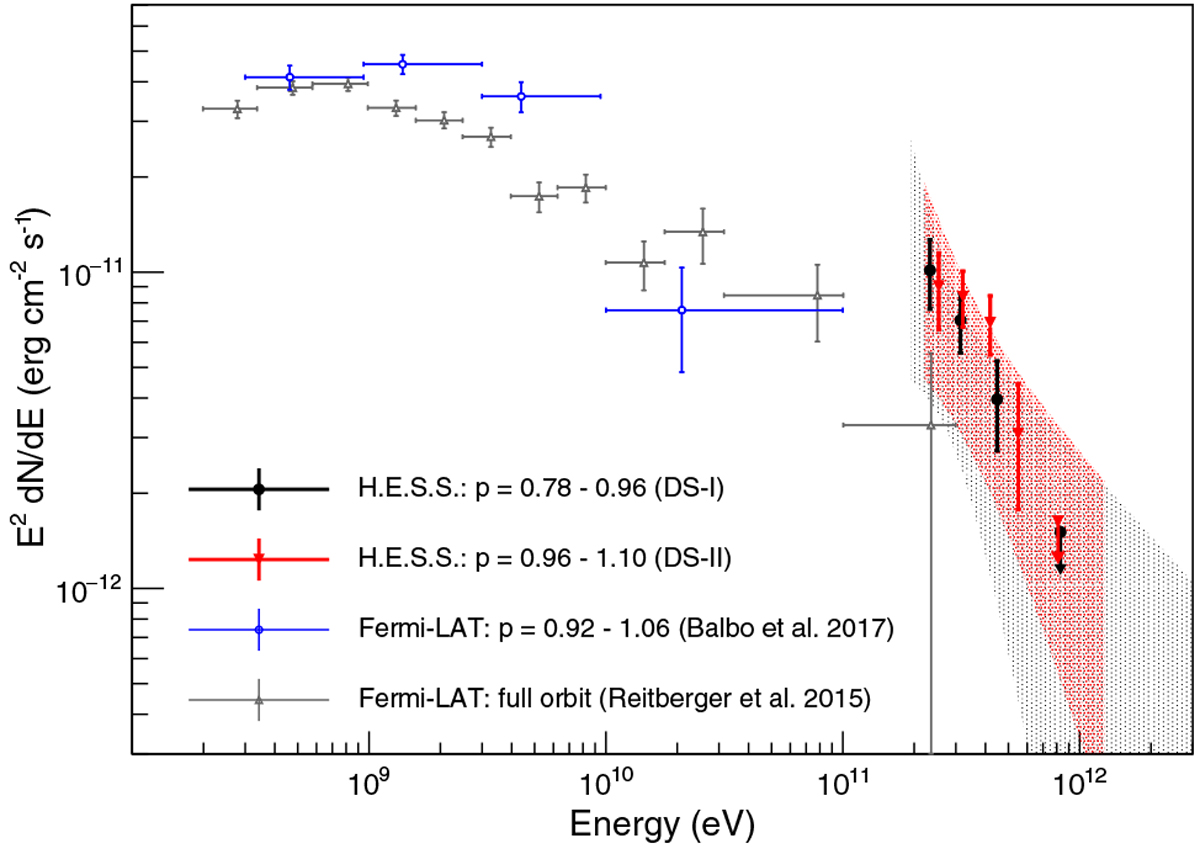
Spectral energy distribution of η Car for DS-I (black) and DS-II (red). H.E.S.S. points show 1σ statistical errors. The shaded regions indicate the combined statistical and systematic errors (as given in the main text and Table 3). Fermi-LAT spectra from Reitberger et al. (2015) for the full orbit (grey) and for the last periastron passage from Balbo & Walter (2017) (blue) are also shown.
Current usage metrics show cumulative count of Article Views (full-text article views including HTML views, PDF and ePub downloads, according to the available data) and Abstracts Views on Vision4Press platform.
Data correspond to usage on the plateform after 2015. The current usage metrics is available 48-96 hours after online publication and is updated daily on week days.
Initial download of the metrics may take a while.