Fig. 2
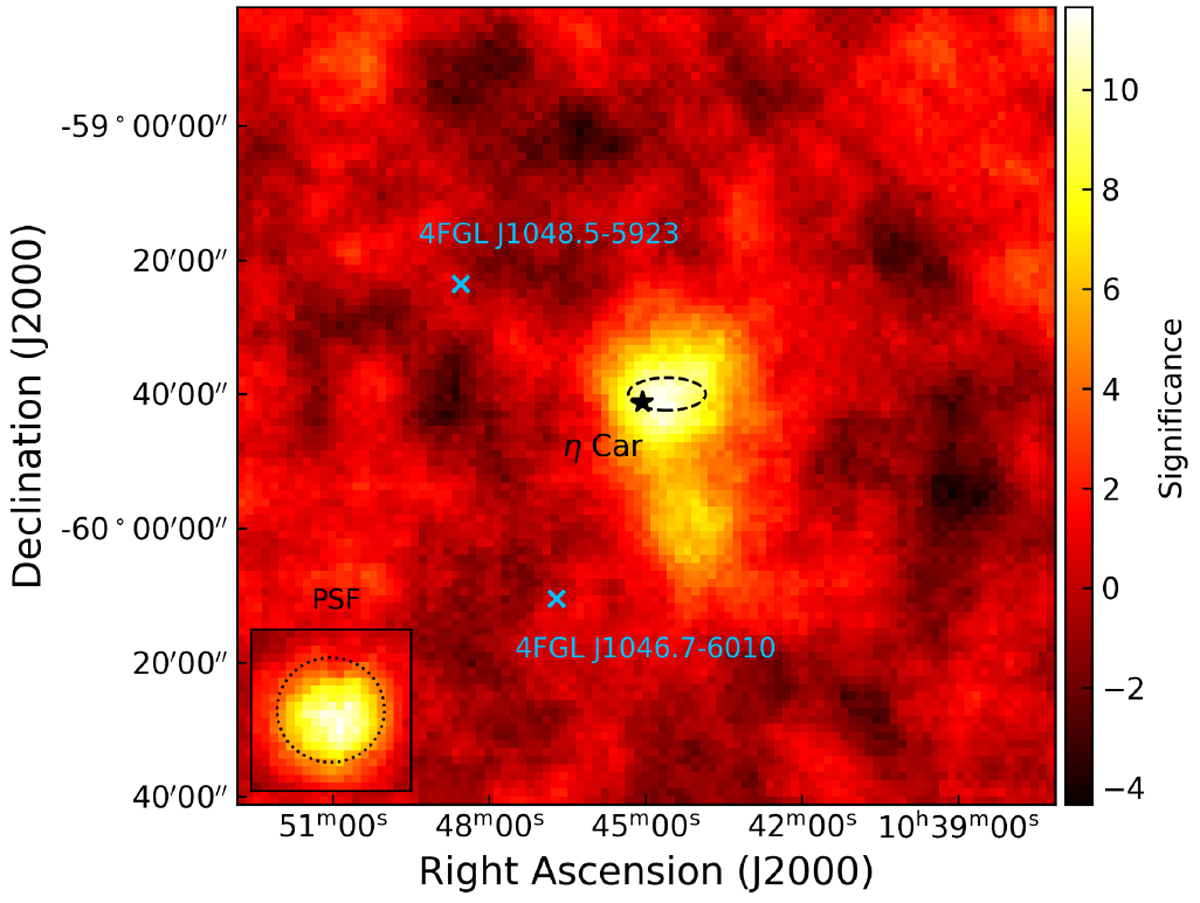
Significance map as obtained in the CT5 mono analysis, for the combined DS-I (0.78 < p < 0.96) and DS-II (1.09 < p < 1.10) using an oversampling radius of 0.1°. The positionof η Car is denoted with a black star and the long-dashed ellipse refers to the uncertainty in the positional fit as described in the main text. The positions of the nearby Fermi-LAT sources 4FGL J1048.5−5923 and 4FGL J1046.7−6010 are shown with blue crosses (The Fermi-LAT Collaboration 2019). The inlay shows the point spread function (PSF) as obtained using run-wise simulations (RWS) in colour, while the overlaid dotted circle indicates the PSF using classical simulations.
Current usage metrics show cumulative count of Article Views (full-text article views including HTML views, PDF and ePub downloads, according to the available data) and Abstracts Views on Vision4Press platform.
Data correspond to usage on the plateform after 2015. The current usage metrics is available 48-96 hours after online publication and is updated daily on week days.
Initial download of the metrics may take a while.