Fig. 1
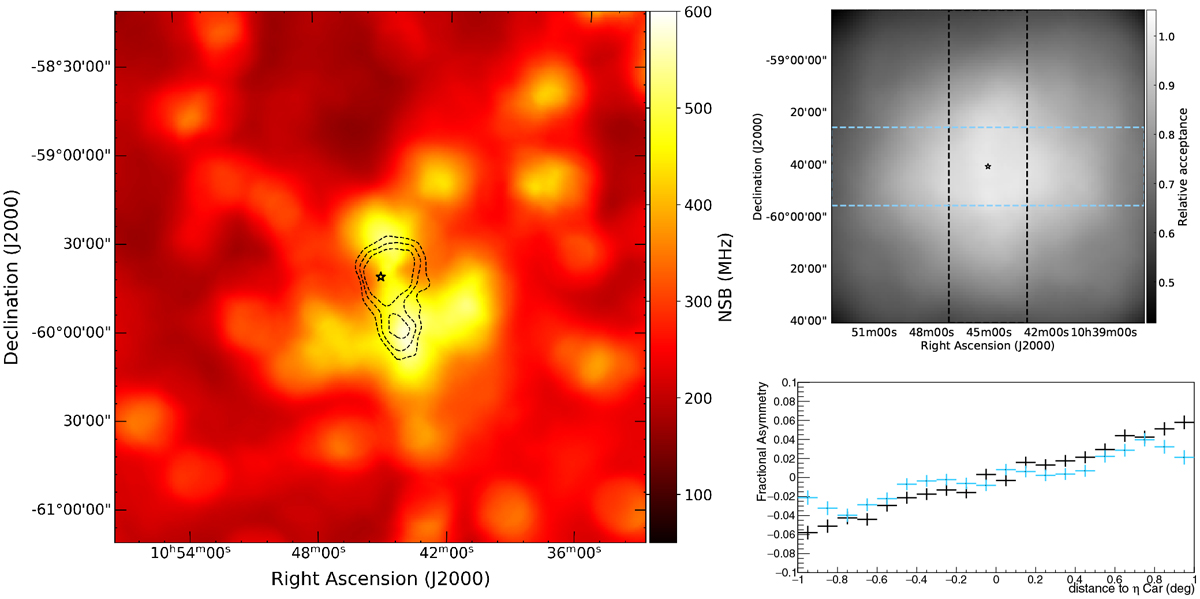
Left: smoothed NSB rate per camera pixel in MHz for CT5 overlaid with contours for 3.5, 4.75 and 6σ of the mono analysis of DS-I and DS-II. Turned-off pixels are treated as 0 MHz, hence the map illustrates the average NSB operating pixels are exposed to. The optical position of η Car is denoted with a small star. Right: zoom into the 2D γ-ray acceptance map (top) and the relative asymmetry in RA and Dec (bottom).
Current usage metrics show cumulative count of Article Views (full-text article views including HTML views, PDF and ePub downloads, according to the available data) and Abstracts Views on Vision4Press platform.
Data correspond to usage on the plateform after 2015. The current usage metrics is available 48-96 hours after online publication and is updated daily on week days.
Initial download of the metrics may take a while.