Open Access
Fig. 13
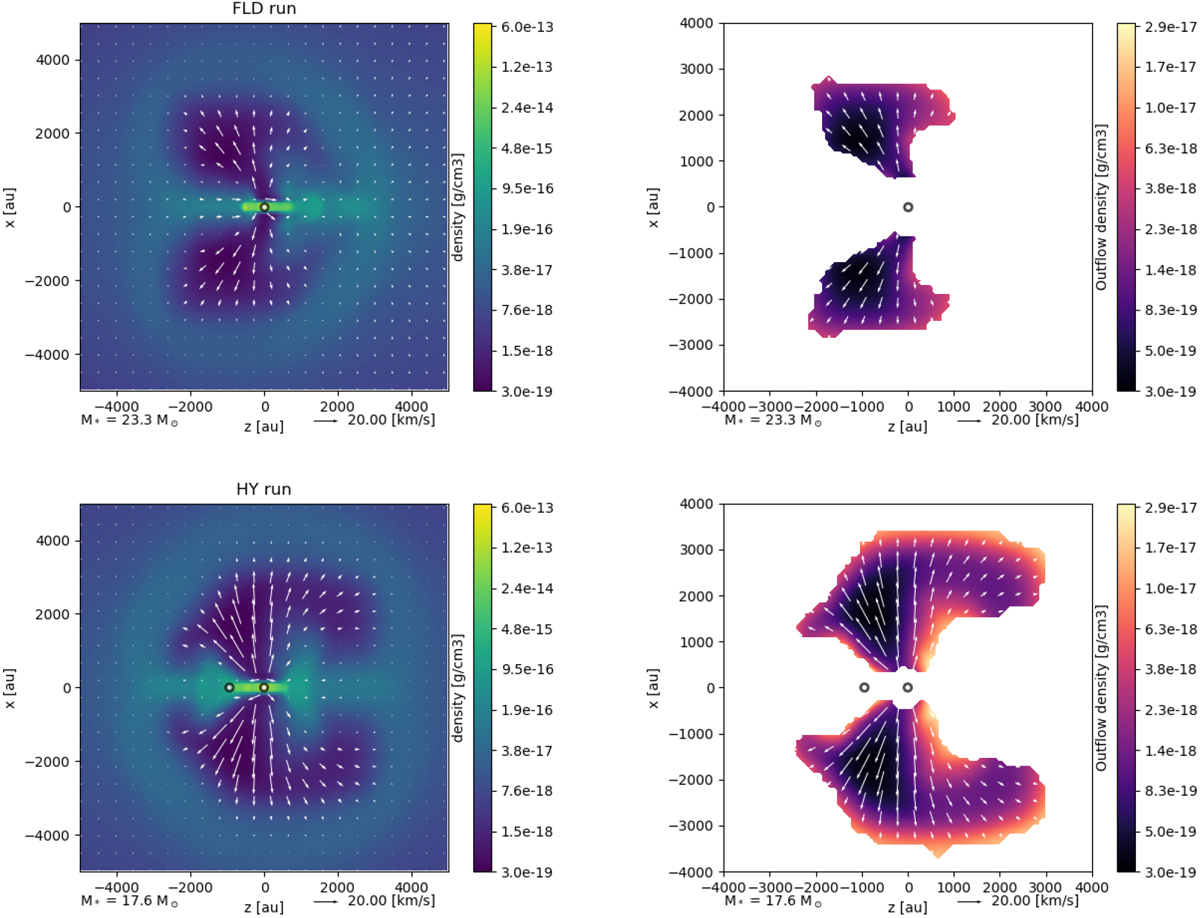
Left panels: density slices perpendicular to the disk in a (10000 AU)2 region. Right panels: density in outflow selections in a (8000 AU)2 region. Top panels: FLD run; bottom panels: HY run. t = 30 kyr. Figures are centered on the location of the most massive sink particle.
Current usage metrics show cumulative count of Article Views (full-text article views including HTML views, PDF and ePub downloads, according to the available data) and Abstracts Views on Vision4Press platform.
Data correspond to usage on the plateform after 2015. The current usage metrics is available 48-96 hours after online publication and is updated daily on week days.
Initial download of the metrics may take a while.