Fig. 5
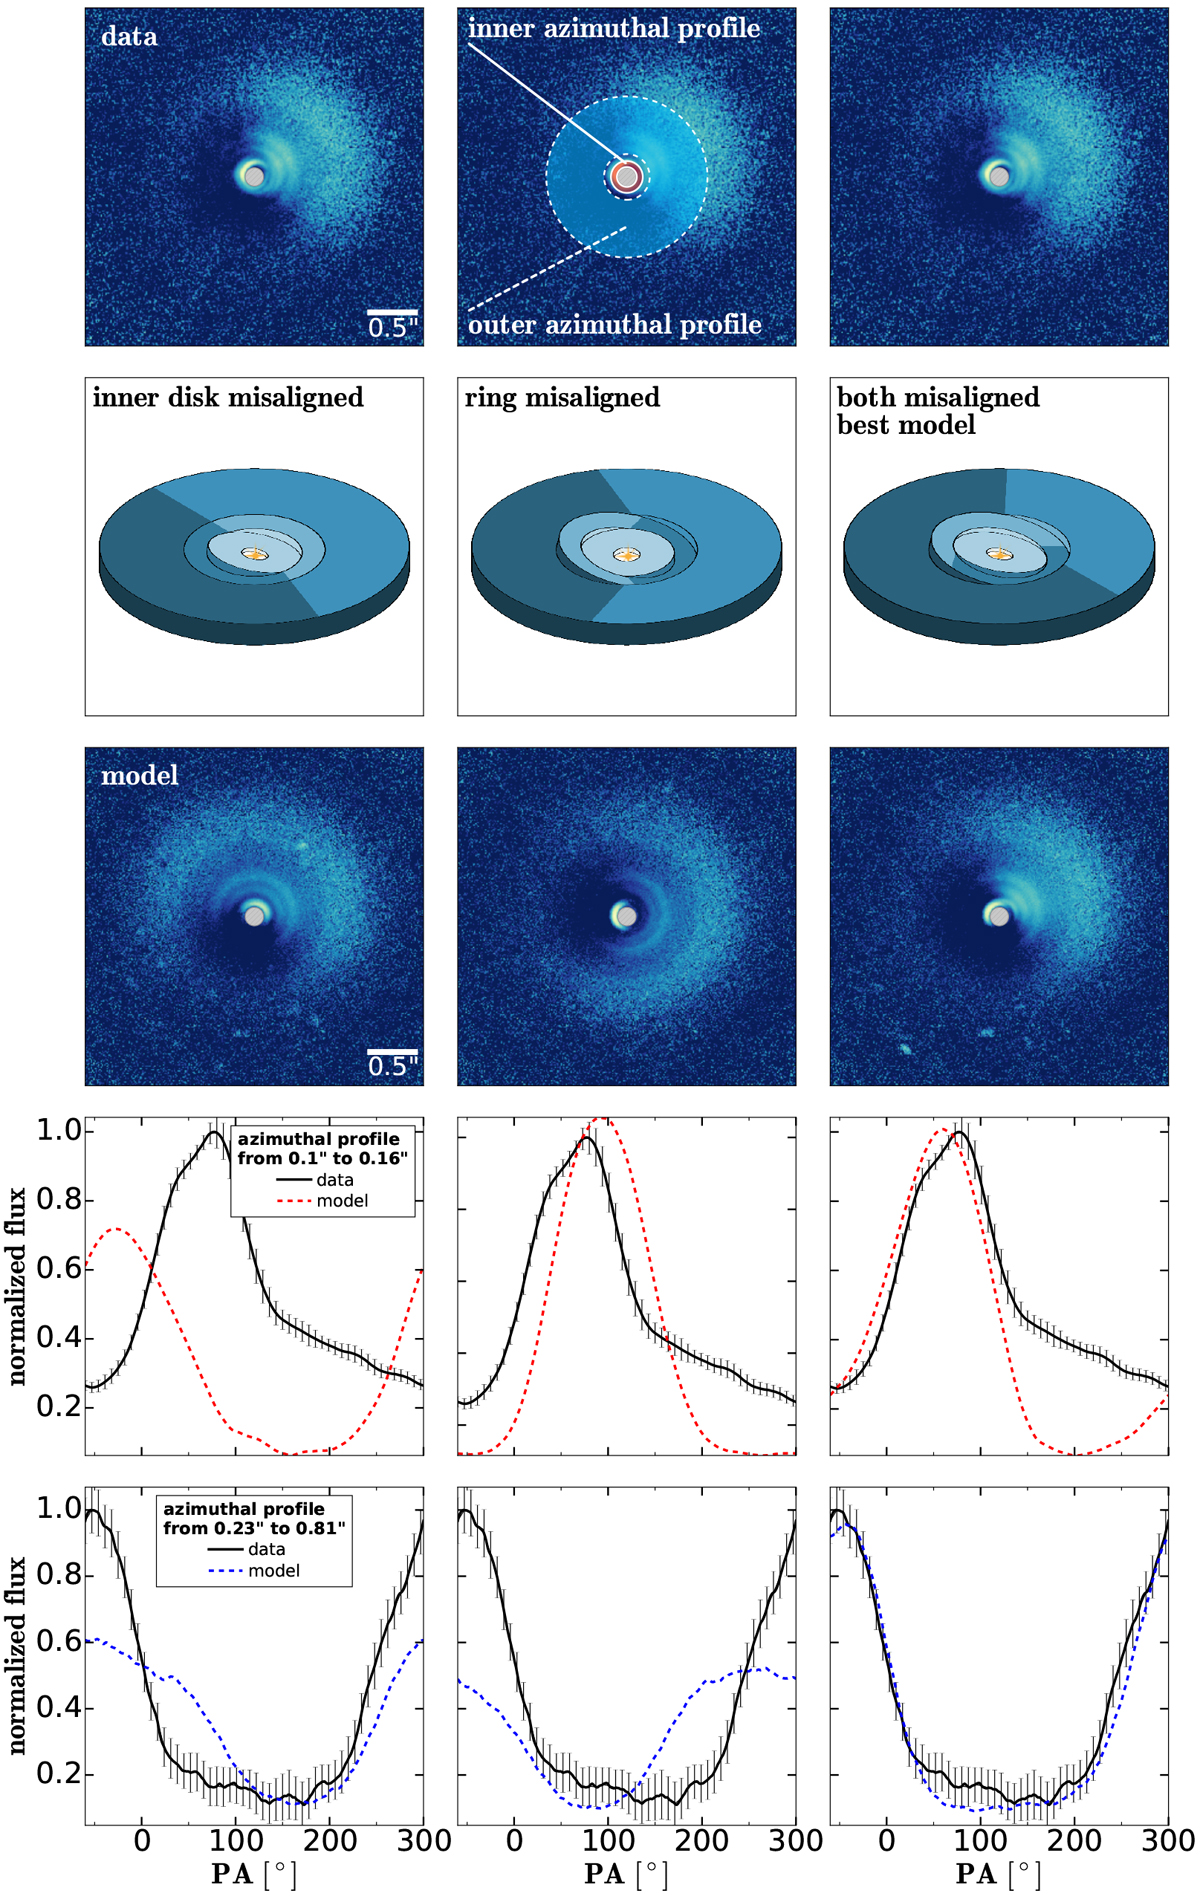
SPHERE combined dataset (first row) compared with three radiative transfer models. Second row and third row: three configurations of the different disk zones and corresponding radiative transfer model predictions. Fourth and fifth rows: (radially averaged) azimuthal profiles, from 0.1′′ to 0.16′′, and from 0.23′′ to 0.81′′, respectively. Middle top panel: regions over which the azimuthal profiles were calculated (red + solid white outline, zone 3; blue+ dashed white outline, zone 4). Left: model including a misalignment of zones 1-2. Middle: model with a misalignment of zone 3. Right: our best model with both zones 1-2 and 3 misaligned.
Current usage metrics show cumulative count of Article Views (full-text article views including HTML views, PDF and ePub downloads, according to the available data) and Abstracts Views on Vision4Press platform.
Data correspond to usage on the plateform after 2015. The current usage metrics is available 48-96 hours after online publication and is updated daily on week days.
Initial download of the metrics may take a while.