Free Access
Fig. 4
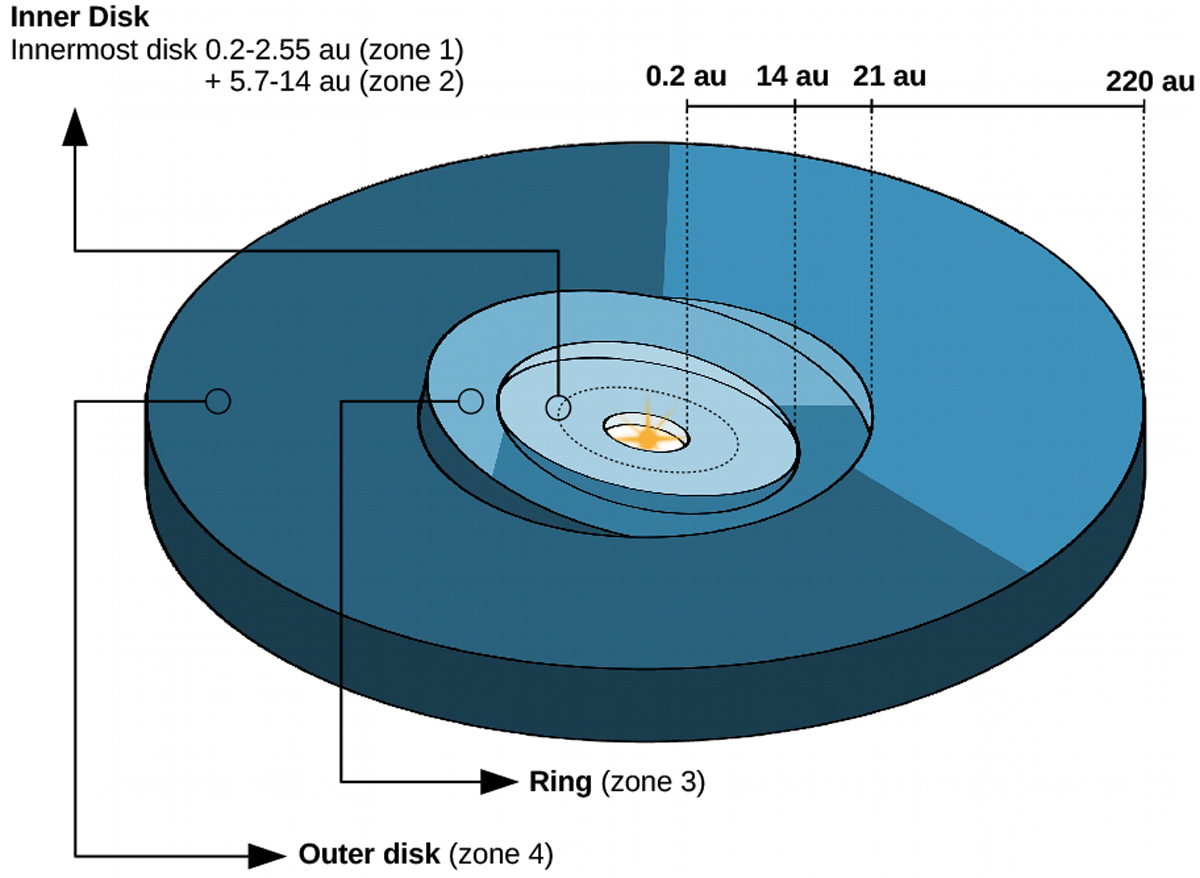
Sketch of our model, showing the various regions of the disk misaligned with respect to each other. The darker regions in each zone represent the shadowed regions. Zones 1 and 2 have the same alignment in our model, and are therefore shown here jointly as the region labeled “inner disk”.
Current usage metrics show cumulative count of Article Views (full-text article views including HTML views, PDF and ePub downloads, according to the available data) and Abstracts Views on Vision4Press platform.
Data correspond to usage on the plateform after 2015. The current usage metrics is available 48-96 hours after online publication and is updated daily on week days.
Initial download of the metrics may take a while.