Fig. 9
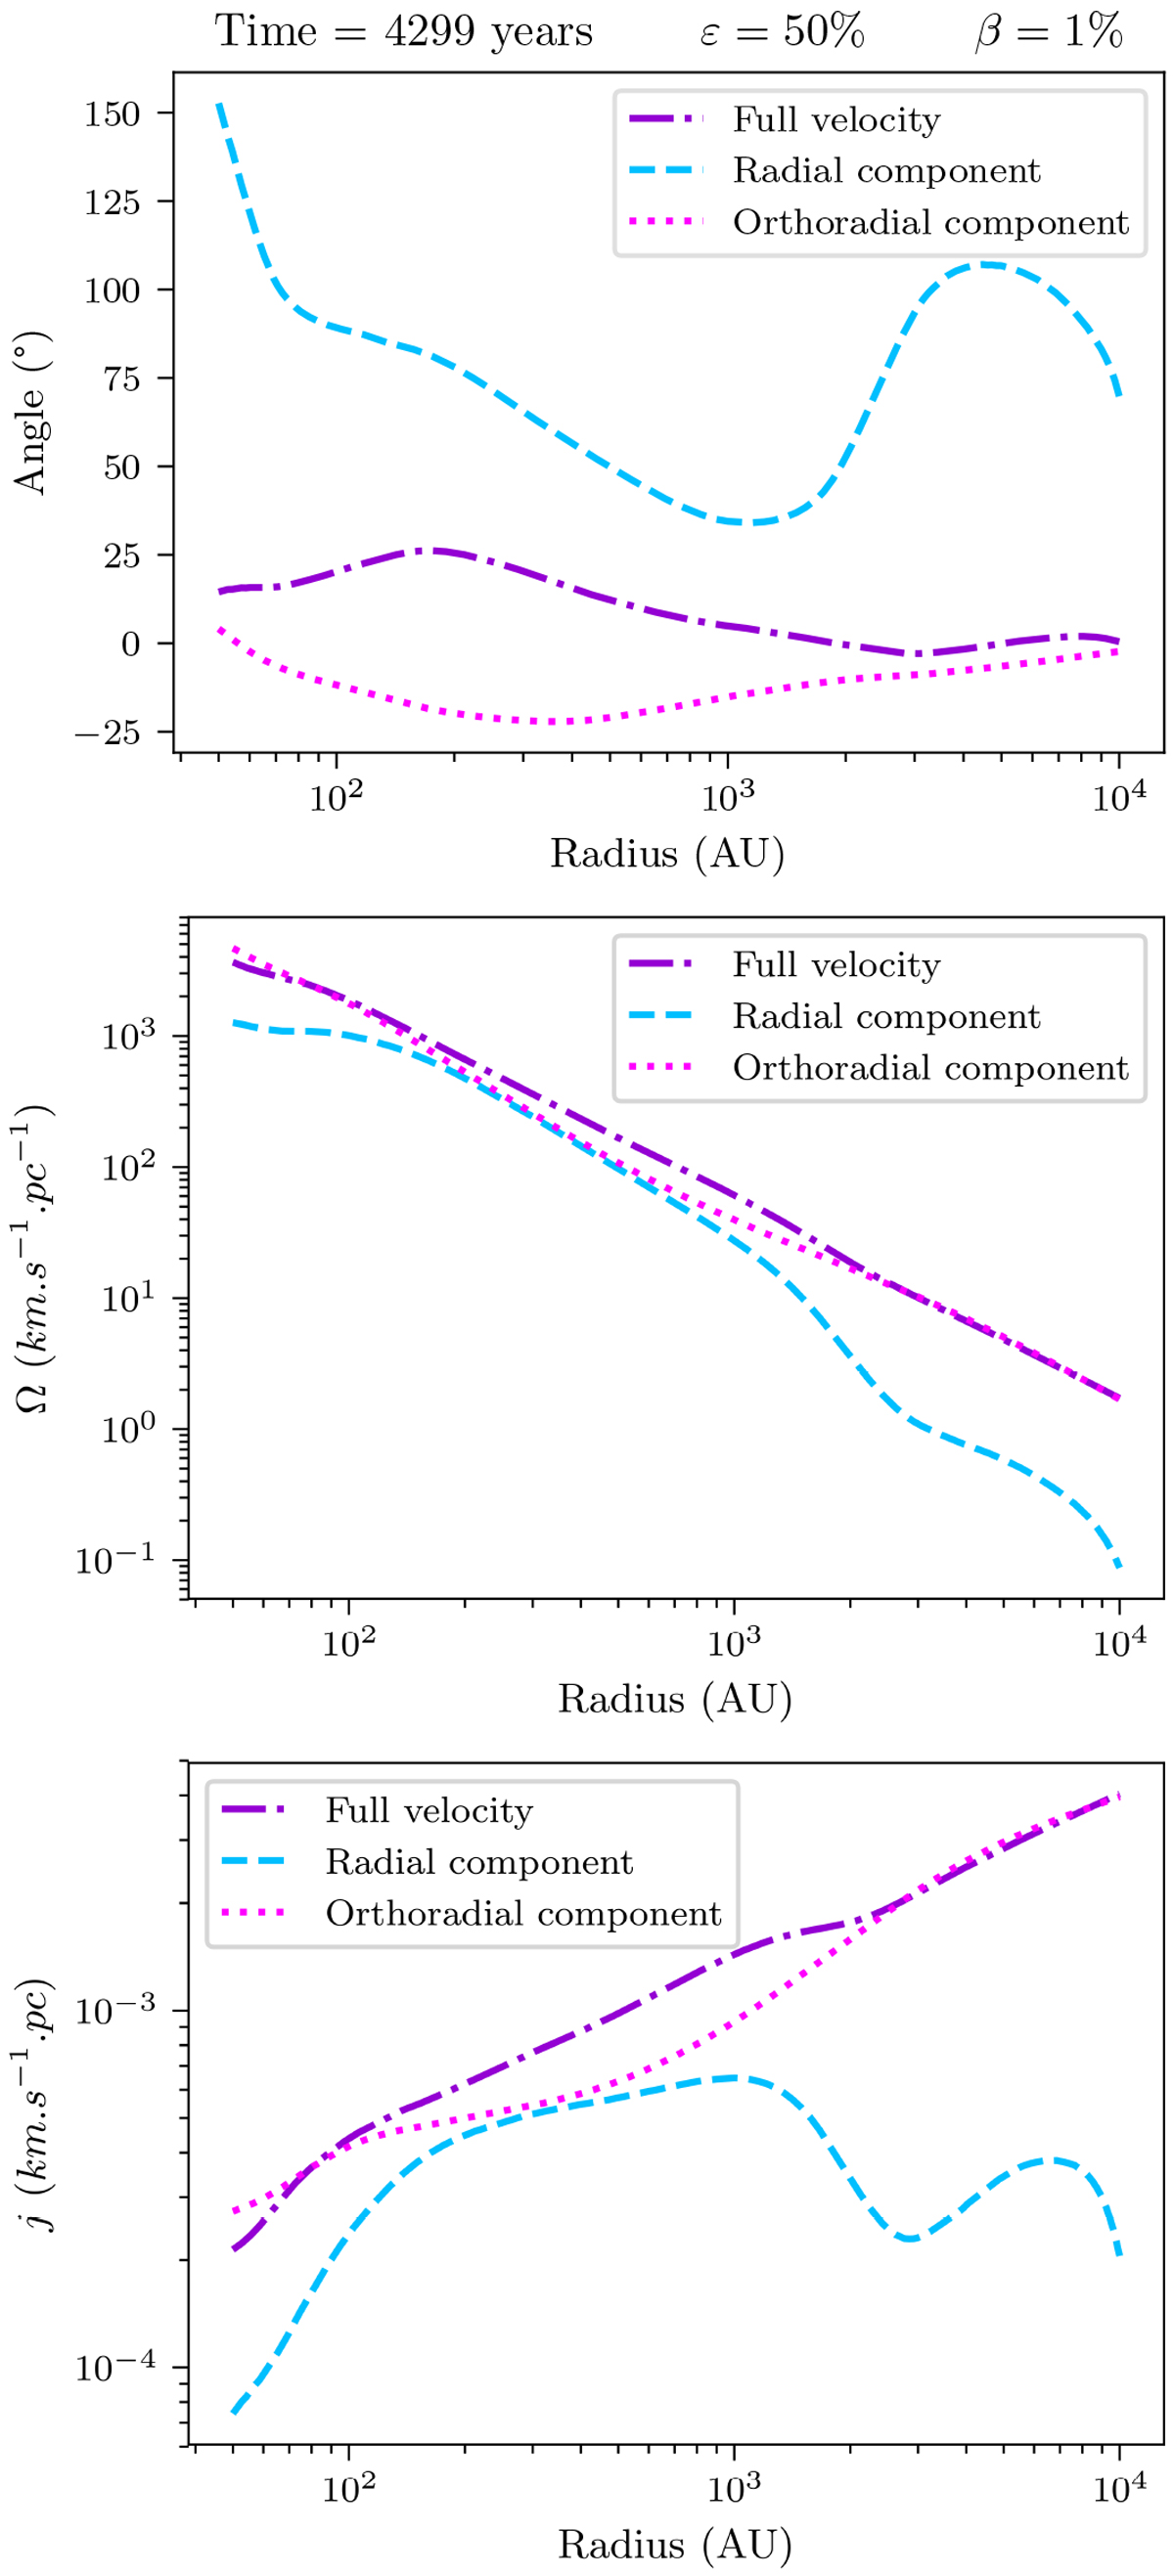
Analysis of velocity gradients for the full velocity (in purple dashdotted), the radial component (in blue dashed), and the orthoradial component (pink dotted). These quantities are represented at different scales in the simulation with 50% of perturbations and β = 1%, for the edge-on projection 1. Top: angular direction of velocity gradients. The origin of the angular direction corresponds to the direction of the disk scale gradient. Middle: amplitude of velocity gradients. Bottom: specific angular momentum as computed in observation analysis.
Current usage metrics show cumulative count of Article Views (full-text article views including HTML views, PDF and ePub downloads, according to the available data) and Abstracts Views on Vision4Press platform.
Data correspond to usage on the plateform after 2015. The current usage metrics is available 48-96 hours after online publication and is updated daily on week days.
Initial download of the metrics may take a while.