Fig. 7
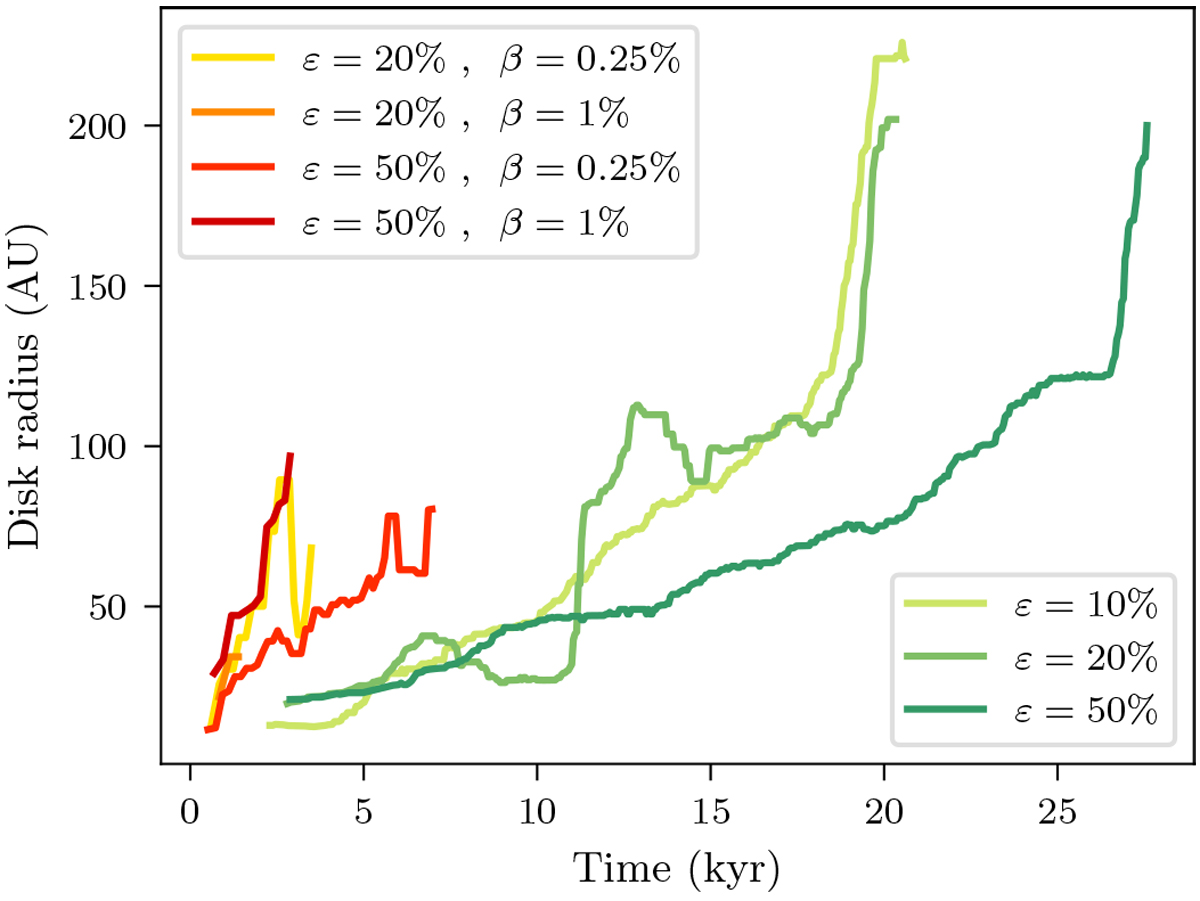
Temporal evolution of disk size for a set of simulations. The three green curves are purely hydrodynamics simulations with different levels of perturbations ε. The four curves from red to yellow are also purely hydrodynamics, but they include an initial solid-body rotation velocity profile, with different levels of perturbations and rotation β. The curves stop when the disk fragments. All of the plotted curves were smoothed by a sliding median.
Current usage metrics show cumulative count of Article Views (full-text article views including HTML views, PDF and ePub downloads, according to the available data) and Abstracts Views on Vision4Press platform.
Data correspond to usage on the plateform after 2015. The current usage metrics is available 48-96 hours after online publication and is updated daily on week days.
Initial download of the metrics may take a while.