Fig. D.2
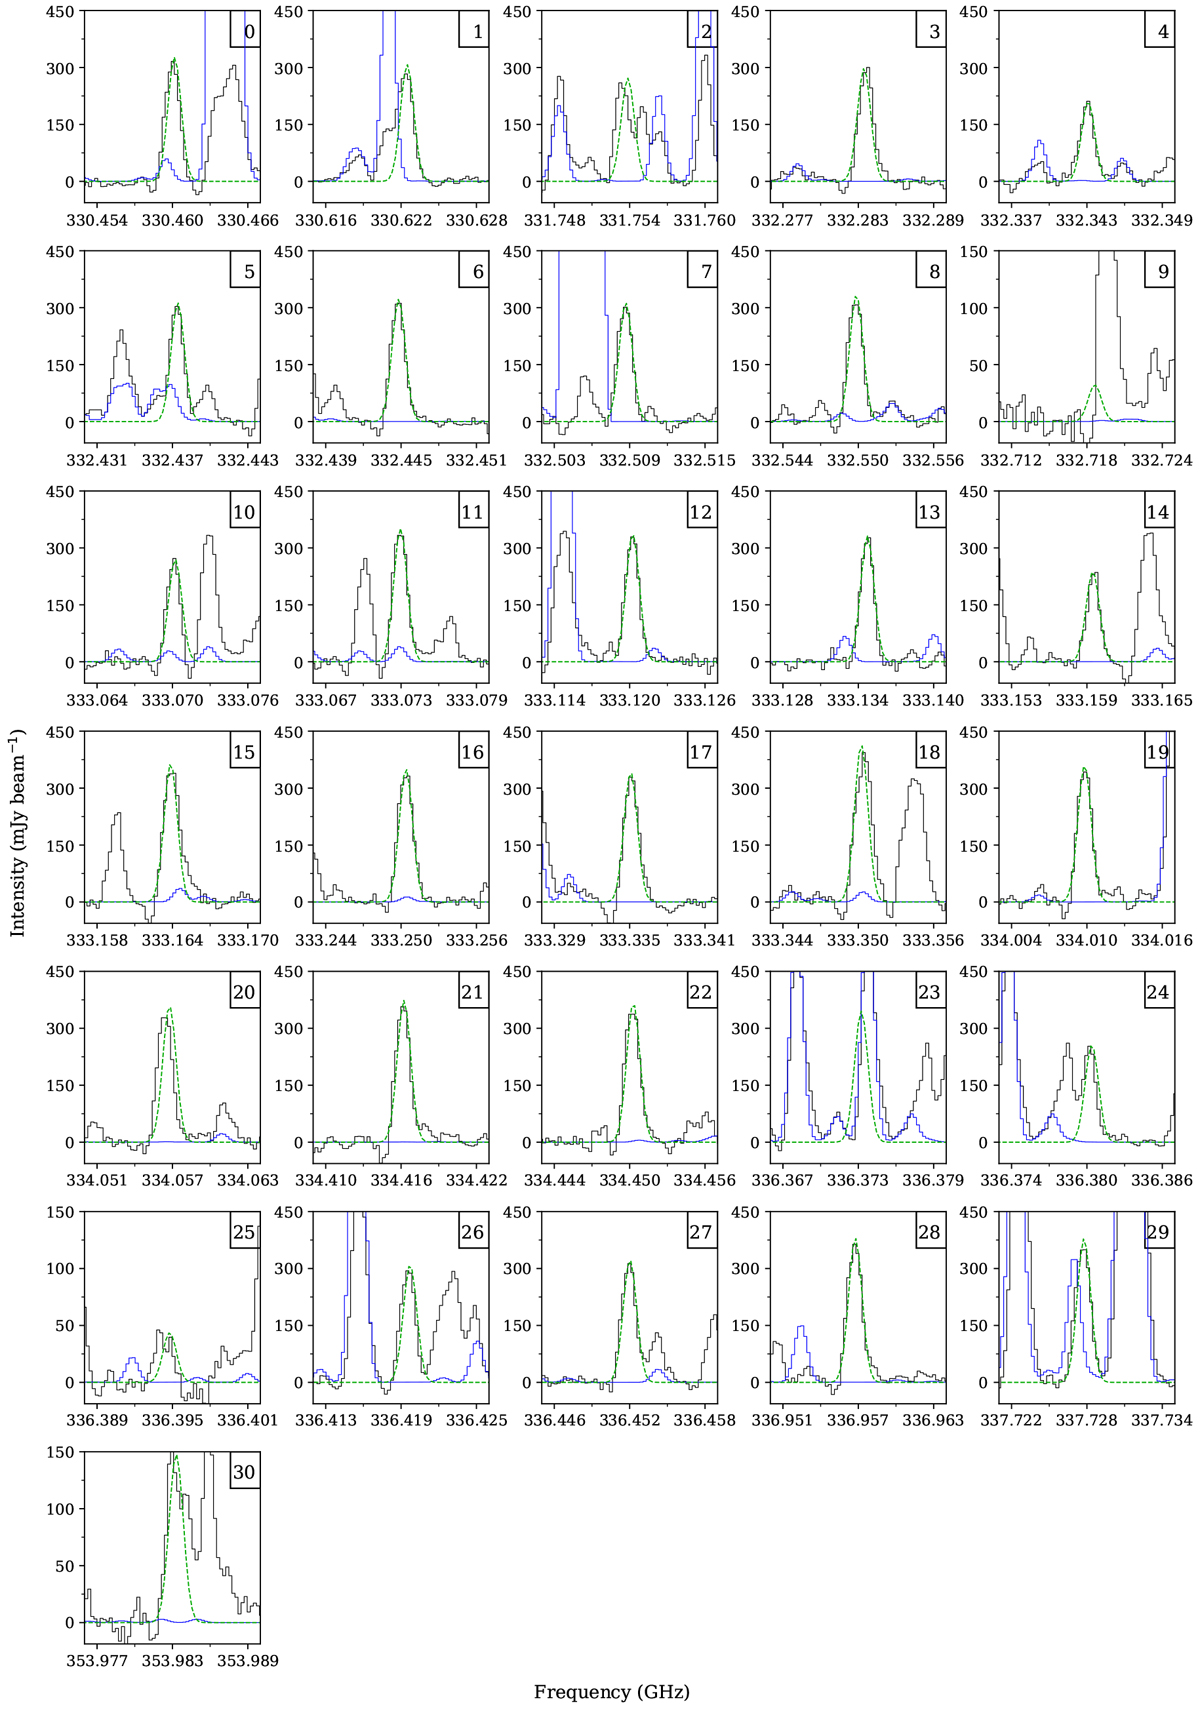
Selection of CHD2OH identified lines towards IRAS 16293 B (in black) with the Gaussian fit in green dashed line, with fixed central velocity and FWHM. The same reference spectrum used in the analysis is represented in blue. The squared number in the top-right corner corresponds to the identification number of the transition, i.e. the panel number in Table D.1.
Current usage metrics show cumulative count of Article Views (full-text article views including HTML views, PDF and ePub downloads, according to the available data) and Abstracts Views on Vision4Press platform.
Data correspond to usage on the plateform after 2015. The current usage metrics is available 48-96 hours after online publication and is updated daily on week days.
Initial download of the metrics may take a while.