Fig. 4
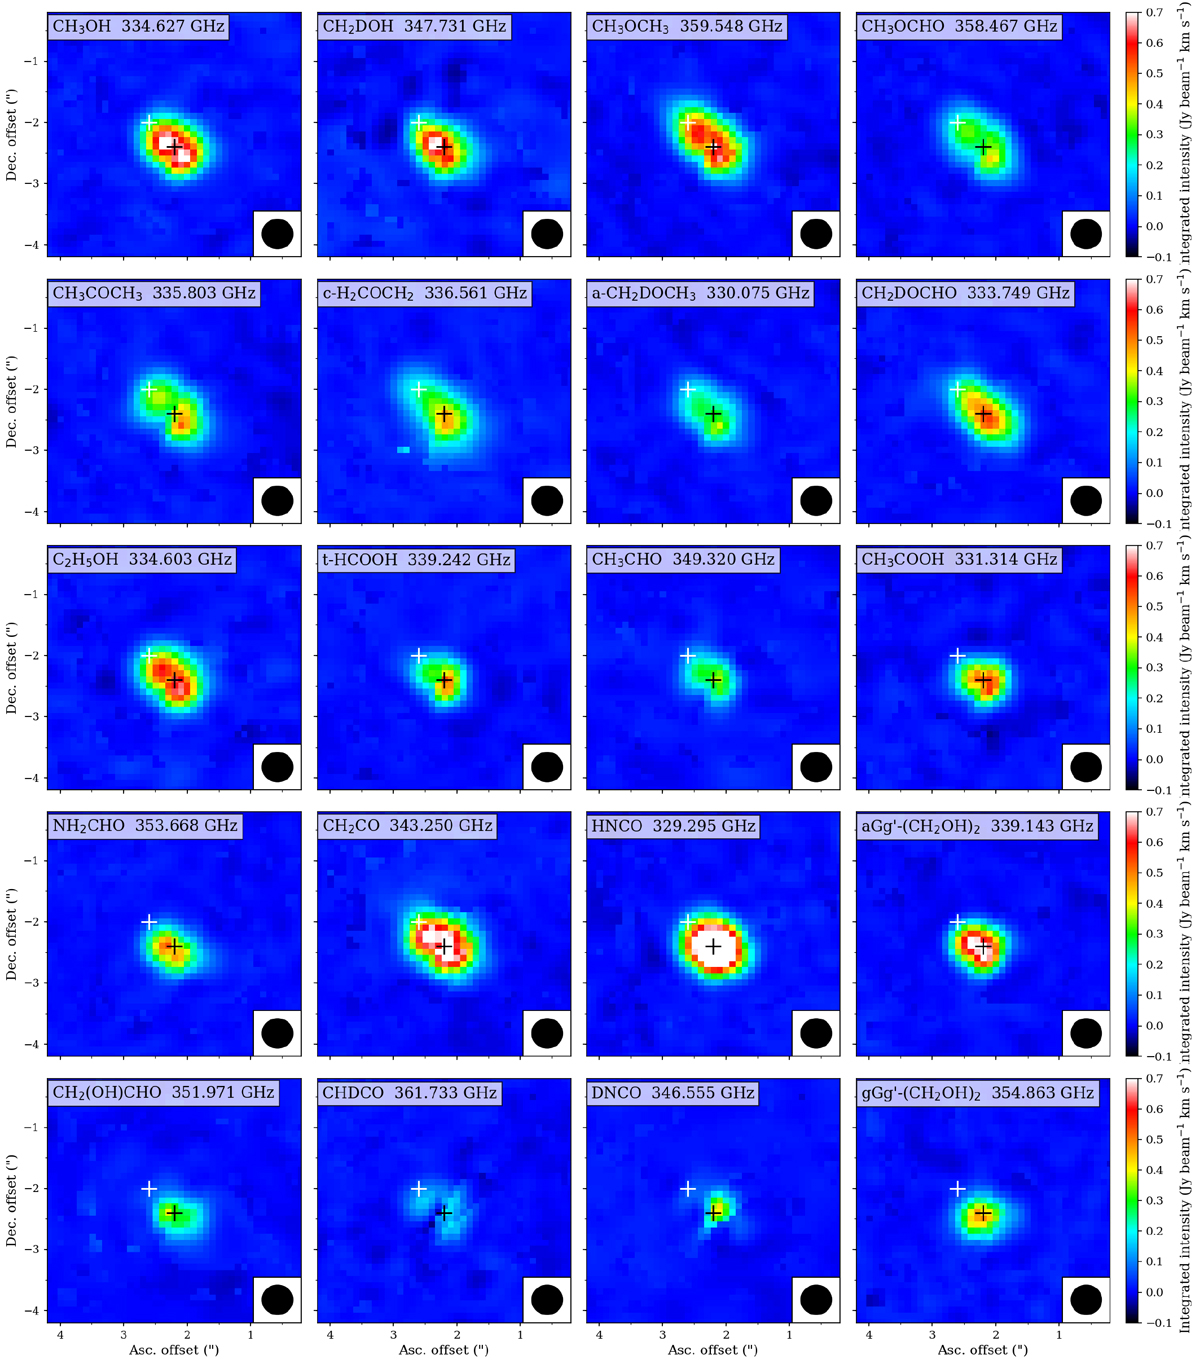
Representative velocity integrated emission maps of the detected COMs towards IRAS 16293 A. The black and white crosses indicate the continuum peak position and the offset position, respectively. The species and the line frequency are noted in the top-left corner and the 0.′′ 5 beam is shown in the bottom right corner of each panels.
Current usage metrics show cumulative count of Article Views (full-text article views including HTML views, PDF and ePub downloads, according to the available data) and Abstracts Views on Vision4Press platform.
Data correspond to usage on the plateform after 2015. The current usage metrics is available 48-96 hours after online publication and is updated daily on week days.
Initial download of the metrics may take a while.