Fig. 3
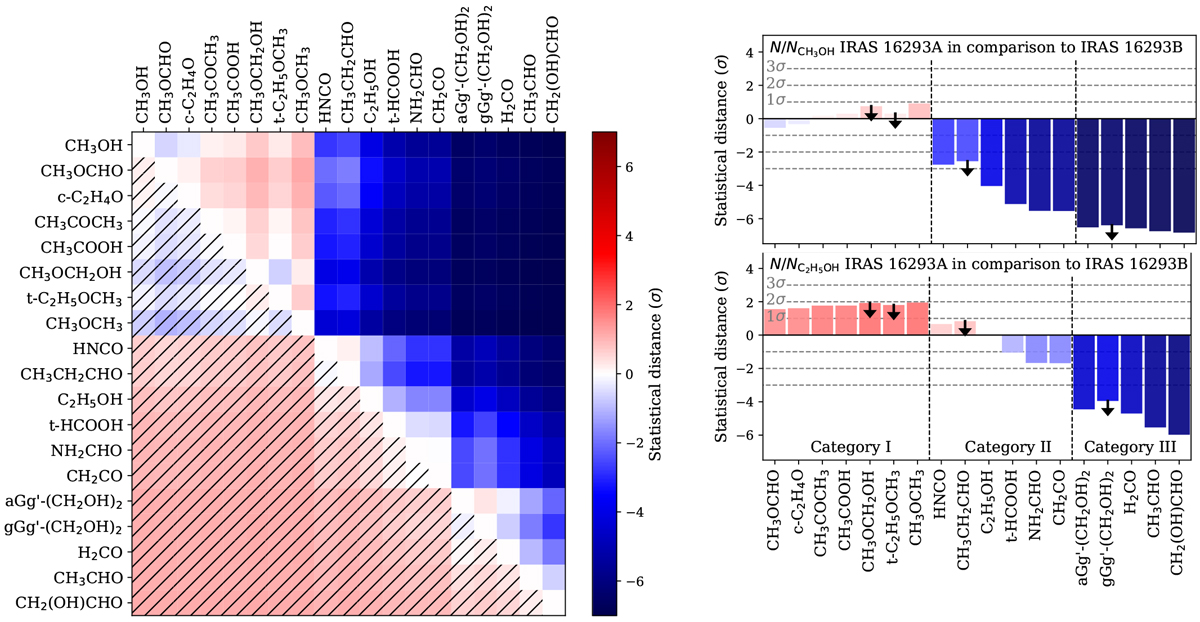
Left: cross-comparison of species from IRAS 16293 A in comparison to those from IRAS 16293 B. The statistical distance S is represented in the colour scale for each pair of species. One cell with a given value S of the plot should be read as “The abundance of the species X with respect to Y towards IRAS 16293 A is S sigma higheror lower compared to IRAS 16293 B”, with X and Y species taken from the X-axis and Y -axis, respectively. A positive value of S corresponds to NX∕NY higher in IRAS 16293 A in comparison to IRAS 16293 B. Right: “CH3OH” and “C2 H5OH” rows of the cross-comparison map. The two plots show the comparison of abundances with respect to CH3 OH (upper panel) and C2H5OH (lower panel) towards IRAS 16293 A and IRAS 16293 B in terms of statistical distance.
Current usage metrics show cumulative count of Article Views (full-text article views including HTML views, PDF and ePub downloads, according to the available data) and Abstracts Views on Vision4Press platform.
Data correspond to usage on the plateform after 2015. The current usage metrics is available 48-96 hours after online publication and is updated daily on week days.
Initial download of the metrics may take a while.