Free Access
Fig. E.10
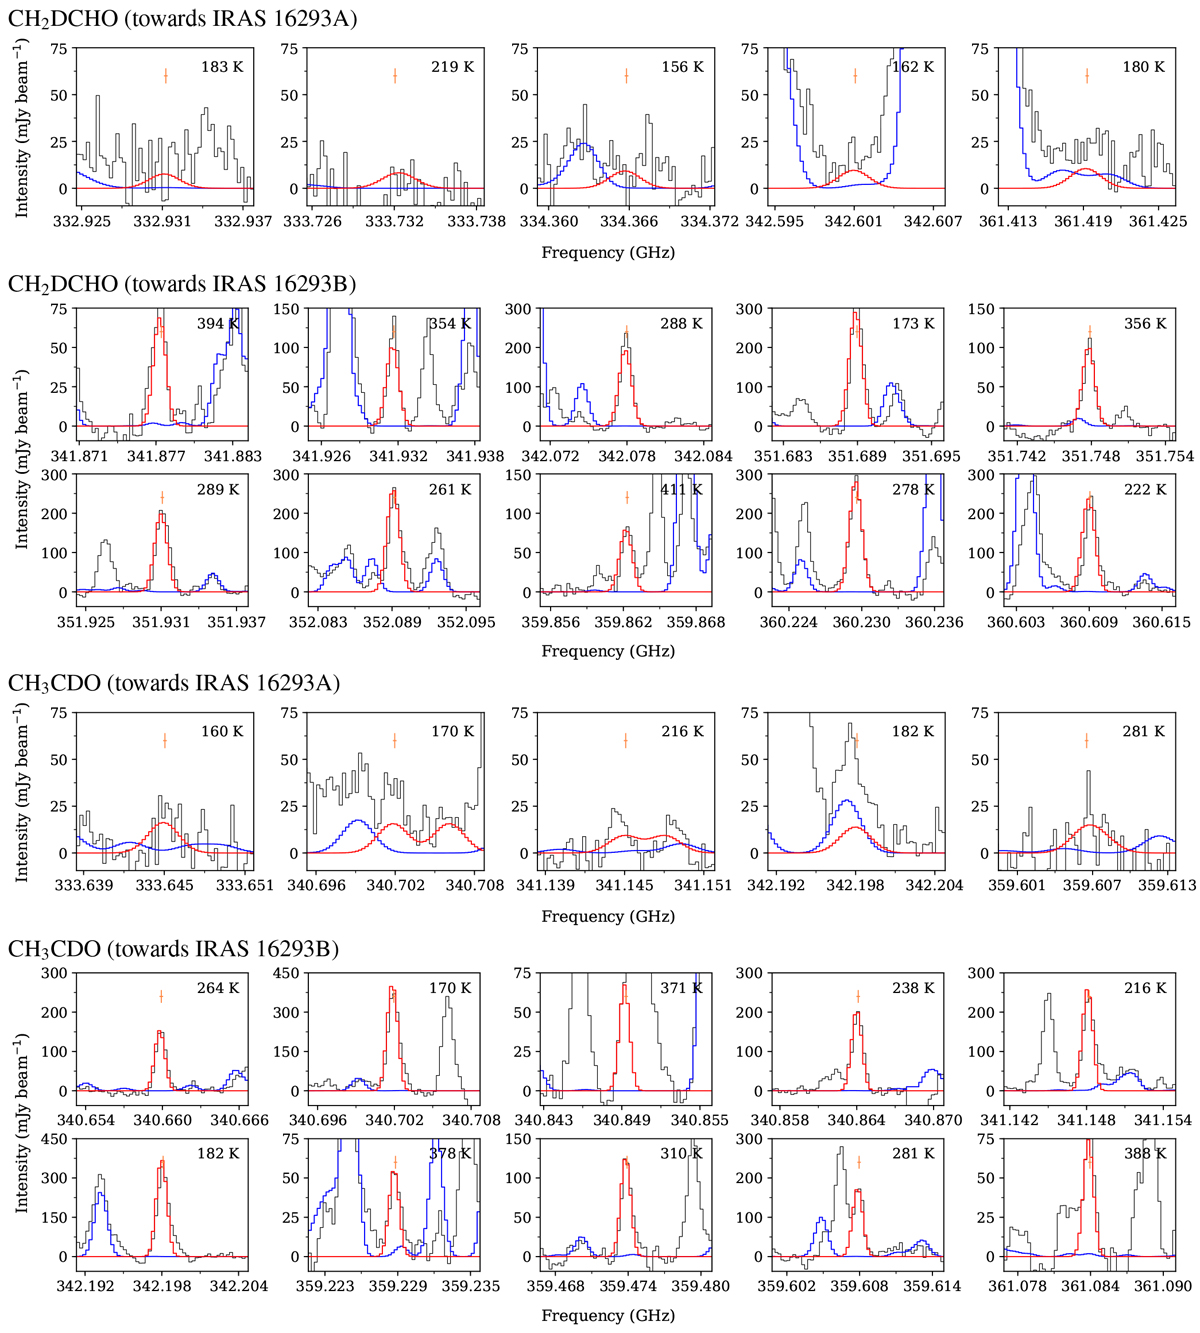
Representative selection of transitions of CH2DCHO and CH3CDO towards IRAS 16293 A and B. The synthetic spectra is over-plotted in red, the reference spectrum in blue, and the data in black. The upper energy level of the transition is indicated in the top-left corner.
Current usage metrics show cumulative count of Article Views (full-text article views including HTML views, PDF and ePub downloads, according to the available data) and Abstracts Views on Vision4Press platform.
Data correspond to usage on the plateform after 2015. The current usage metrics is available 48-96 hours after online publication and is updated daily on week days.
Initial download of the metrics may take a while.