Fig. 9.
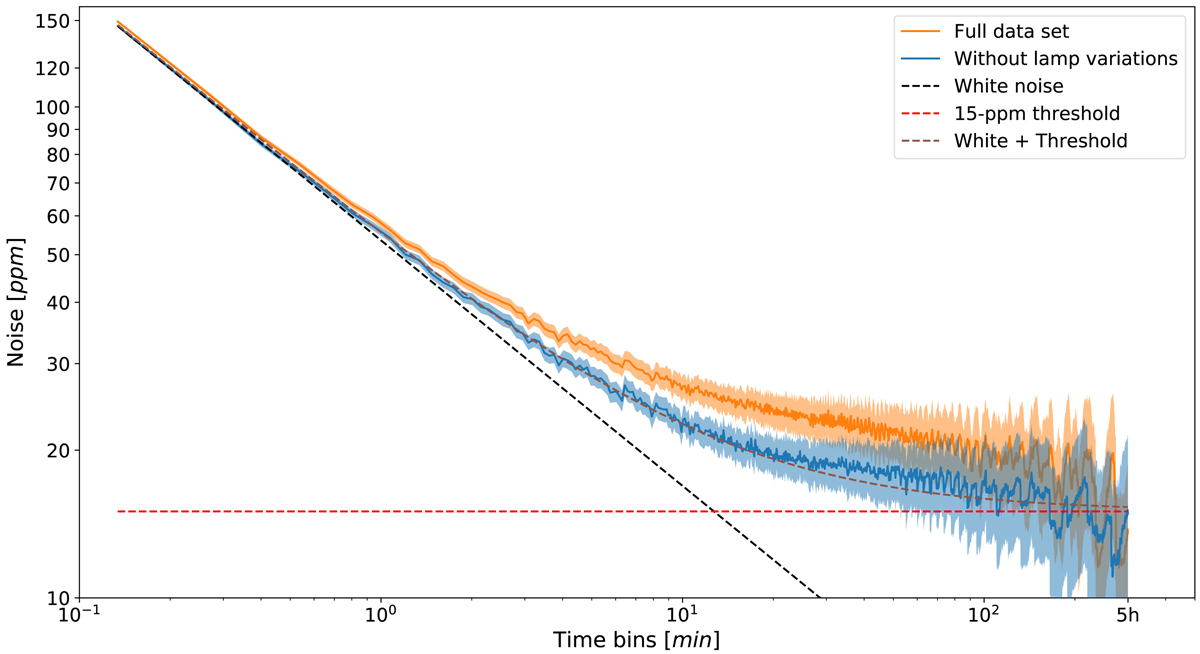
Noise curve of corrected and de-trended light curve (orange) with the estimated errors represented by the shaded areas. The blue curve shows the result after discarding the points taken during abrupt variations of the lamp (t > 1320 min). The noise values are not computed for time bins greater than 5 h to ensure at least four points in the binned data. The brown dashed curve is the quadratic sum of the white noise slope (oblique black dashed line) and an arbitrary threshold at 15 ppm (horizontal red dashed line).
Current usage metrics show cumulative count of Article Views (full-text article views including HTML views, PDF and ePub downloads, according to the available data) and Abstracts Views on Vision4Press platform.
Data correspond to usage on the plateform after 2015. The current usage metrics is available 48-96 hours after online publication and is updated daily on week days.
Initial download of the metrics may take a while.