Free Access
Fig. 8.
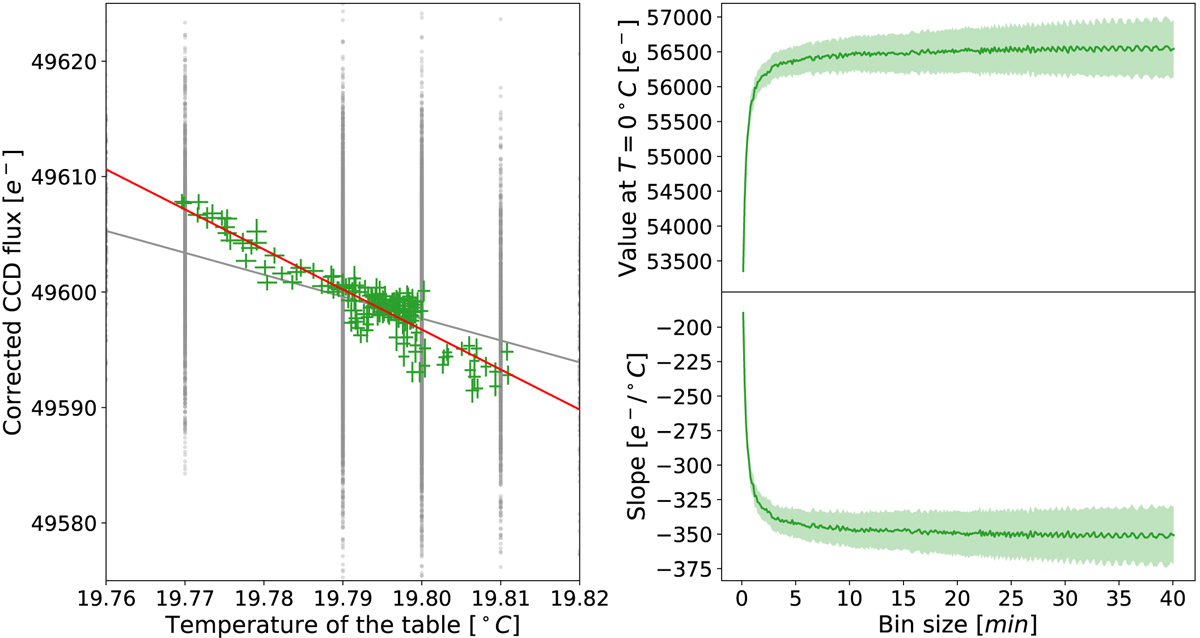
Temperature-flux scatter plot (left panel), with the raw data in grey and the 10-min binned data overplotted in green. The respective linear fits are indicated by the grey and red solid lines. Linear-fit parameters (slope and value at T = 0°C) versus time-length considered for binning (right panels).
Current usage metrics show cumulative count of Article Views (full-text article views including HTML views, PDF and ePub downloads, according to the available data) and Abstracts Views on Vision4Press platform.
Data correspond to usage on the plateform after 2015. The current usage metrics is available 48-96 hours after online publication and is updated daily on week days.
Initial download of the metrics may take a while.