Free Access
Fig. 7.
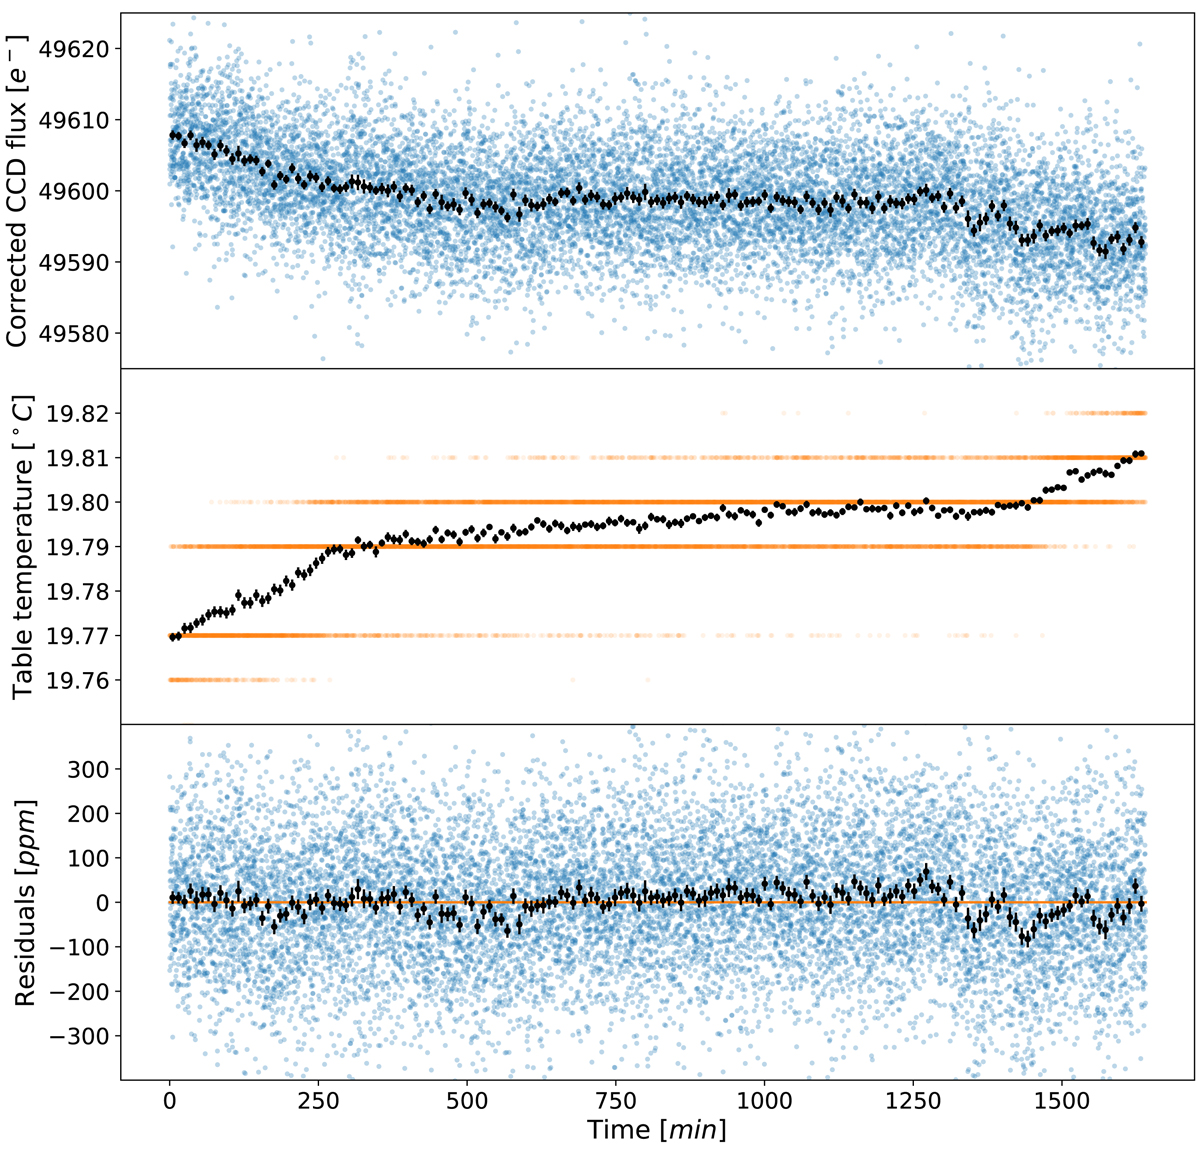
Light curve corrected for the source variability (top panel). Temperature of the optical table (middle panel). Residuals after correction of temperature correlation (bottom panel). The black points represent the 10-min data binned.
Current usage metrics show cumulative count of Article Views (full-text article views including HTML views, PDF and ePub downloads, according to the available data) and Abstracts Views on Vision4Press platform.
Data correspond to usage on the plateform after 2015. The current usage metrics is available 48-96 hours after online publication and is updated daily on week days.
Initial download of the metrics may take a while.