Fig. 4.
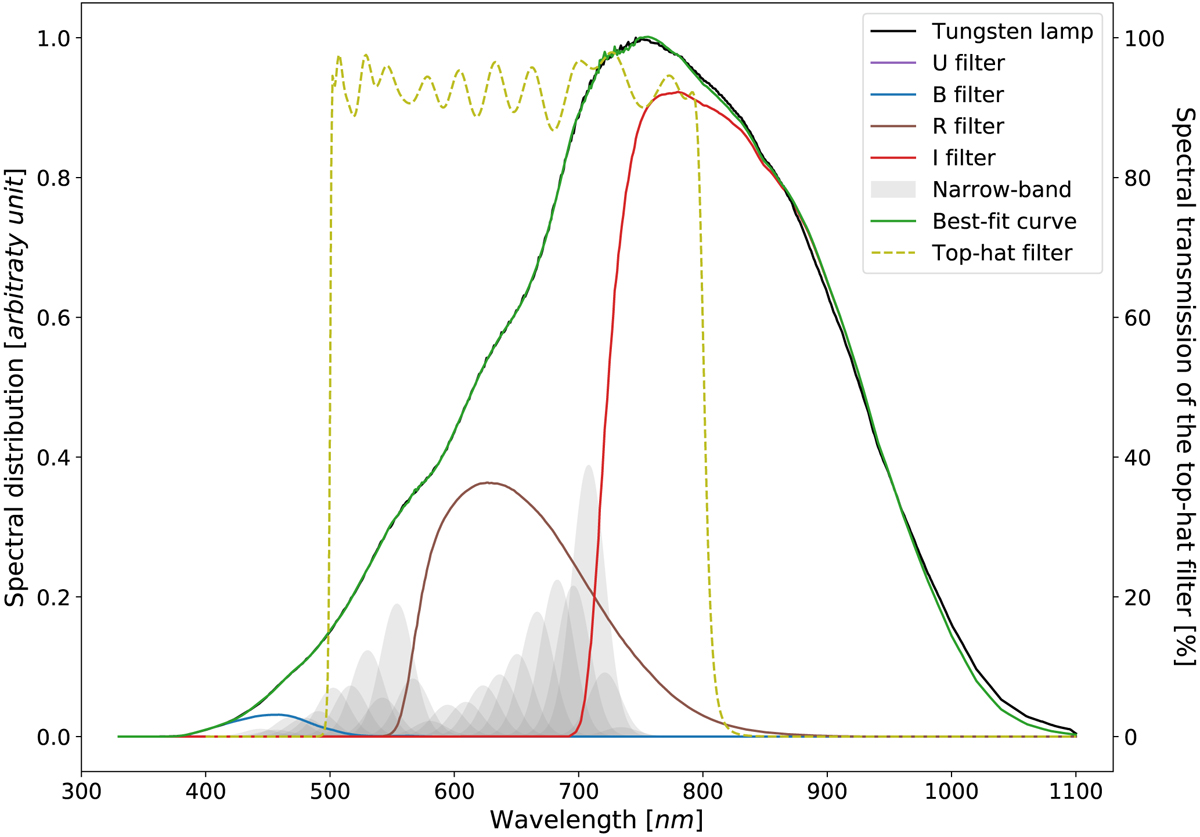
Weighted spectral distributions of the U, B, R, I (Johnson/Bessel filters) and narrow-band filters used to fit the Tungsten lamp profile (black). The weighted sum of the distributions is the “best-fit curve” (green). The spectral transmission of the top-hat filter (yellow dashed line) has been added for information (see Sect. 4.1).
Current usage metrics show cumulative count of Article Views (full-text article views including HTML views, PDF and ePub downloads, according to the available data) and Abstracts Views on Vision4Press platform.
Data correspond to usage on the plateform after 2015. The current usage metrics is available 48-96 hours after online publication and is updated daily on week days.
Initial download of the metrics may take a while.