Fig. 12.
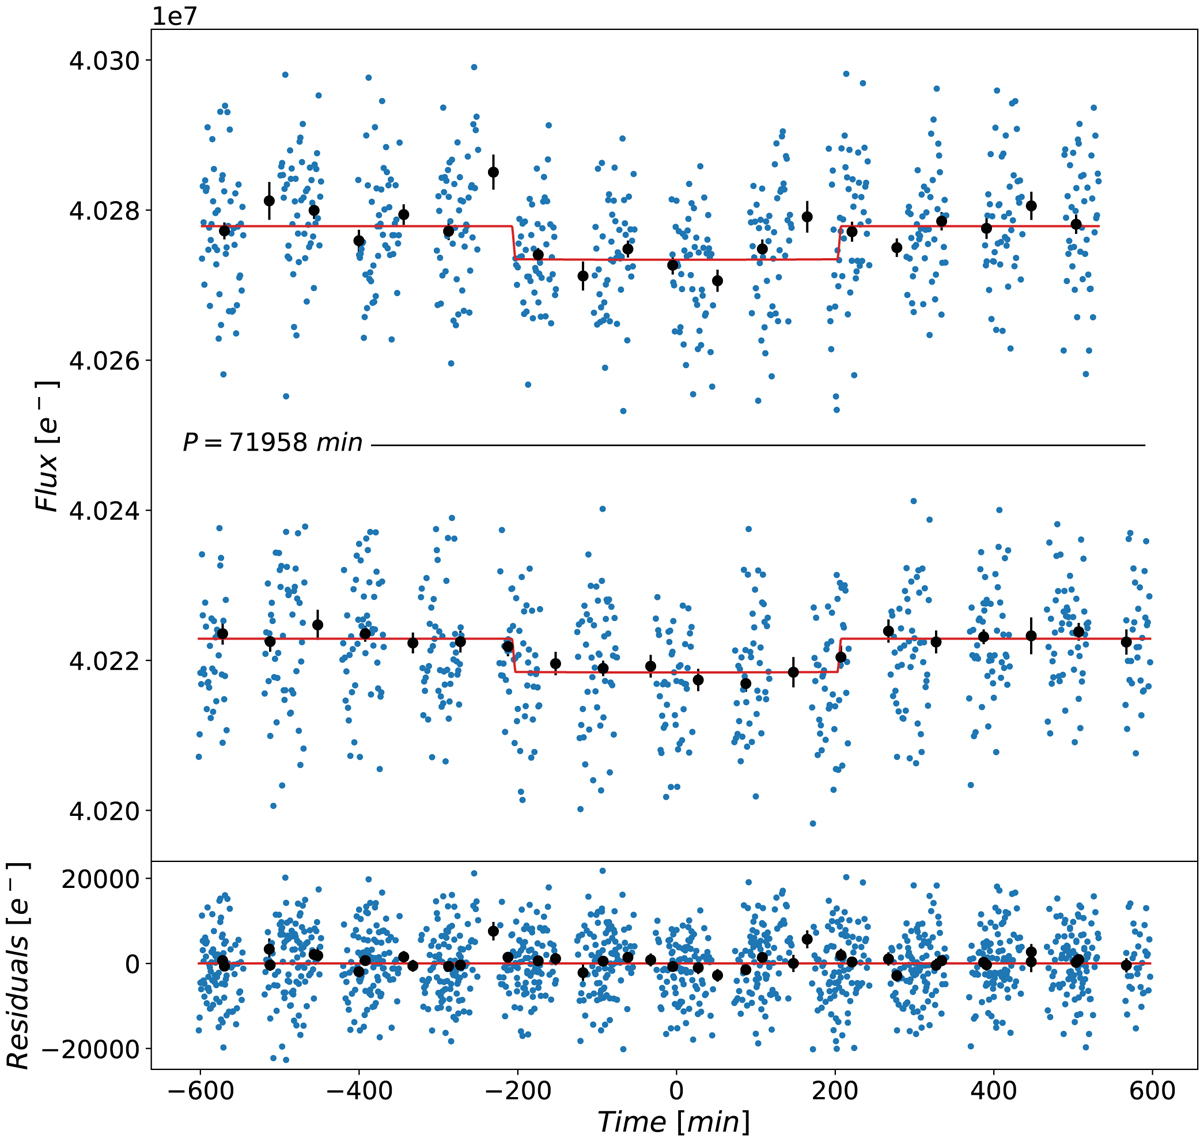
Light curves of the stellar flux (top) extracted from the simulated images of two transits of an Earth-size planet in front of a Sun-like star (case 1). The two transits are phase-folded. The black points are the 60-min binned data and the red curve corresponds to the best-fit model. The regular data gaps visible in the series are related to pointing visibility limits of CHEOPS during its orbit. Time is expressed from mid-transit. Phase-folded residuals (bottom).
Current usage metrics show cumulative count of Article Views (full-text article views including HTML views, PDF and ePub downloads, according to the available data) and Abstracts Views on Vision4Press platform.
Data correspond to usage on the plateform after 2015. The current usage metrics is available 48-96 hours after online publication and is updated daily on week days.
Initial download of the metrics may take a while.