Free Access
Fig. 10.
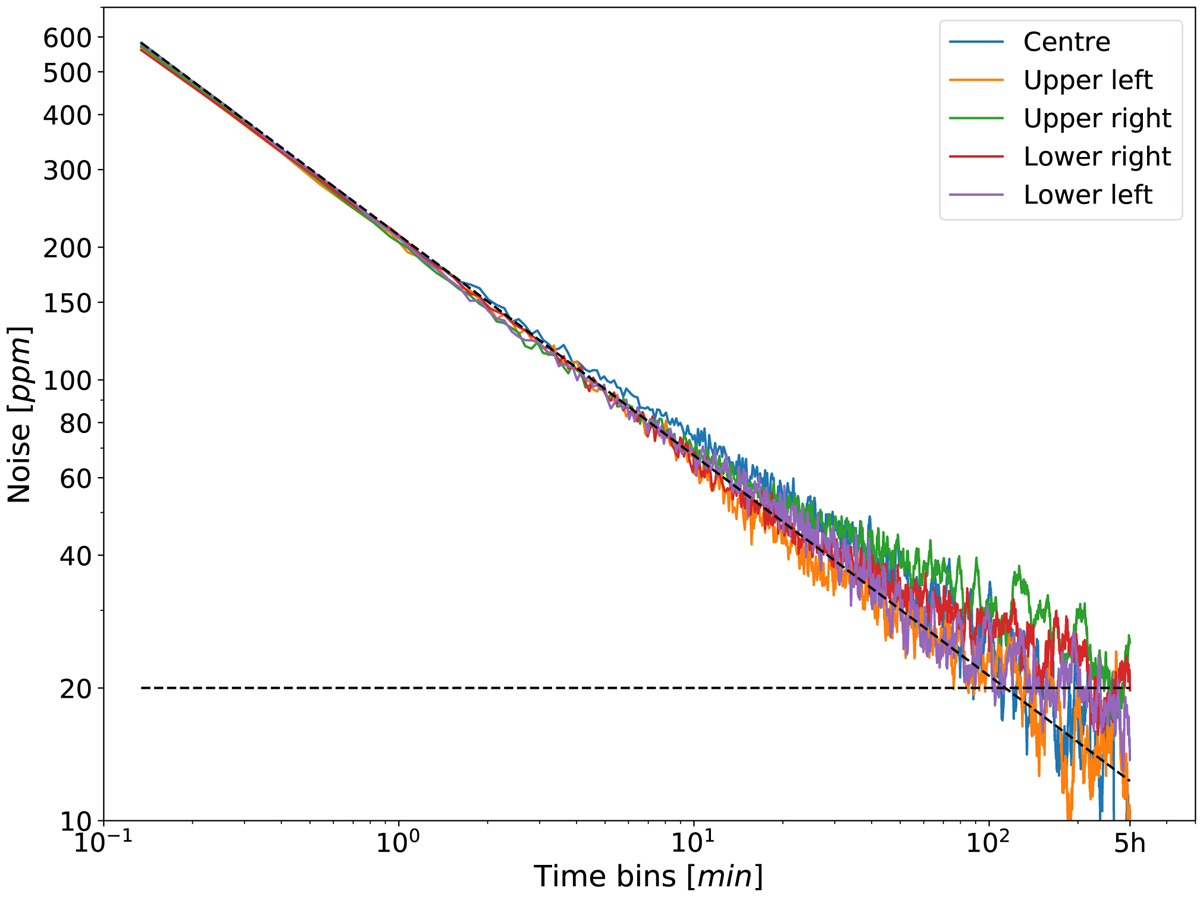
Noise curves of the flux extracted from five 8×8-pixel windows located at different positions on the detector (as indicated by the legend). The oblique black dashed line indicates the theoretical white noise slope while the horizontal line illustrates the 20 ppm level.
Current usage metrics show cumulative count of Article Views (full-text article views including HTML views, PDF and ePub downloads, according to the available data) and Abstracts Views on Vision4Press platform.
Data correspond to usage on the plateform after 2015. The current usage metrics is available 48-96 hours after online publication and is updated daily on week days.
Initial download of the metrics may take a while.