Fig. 4
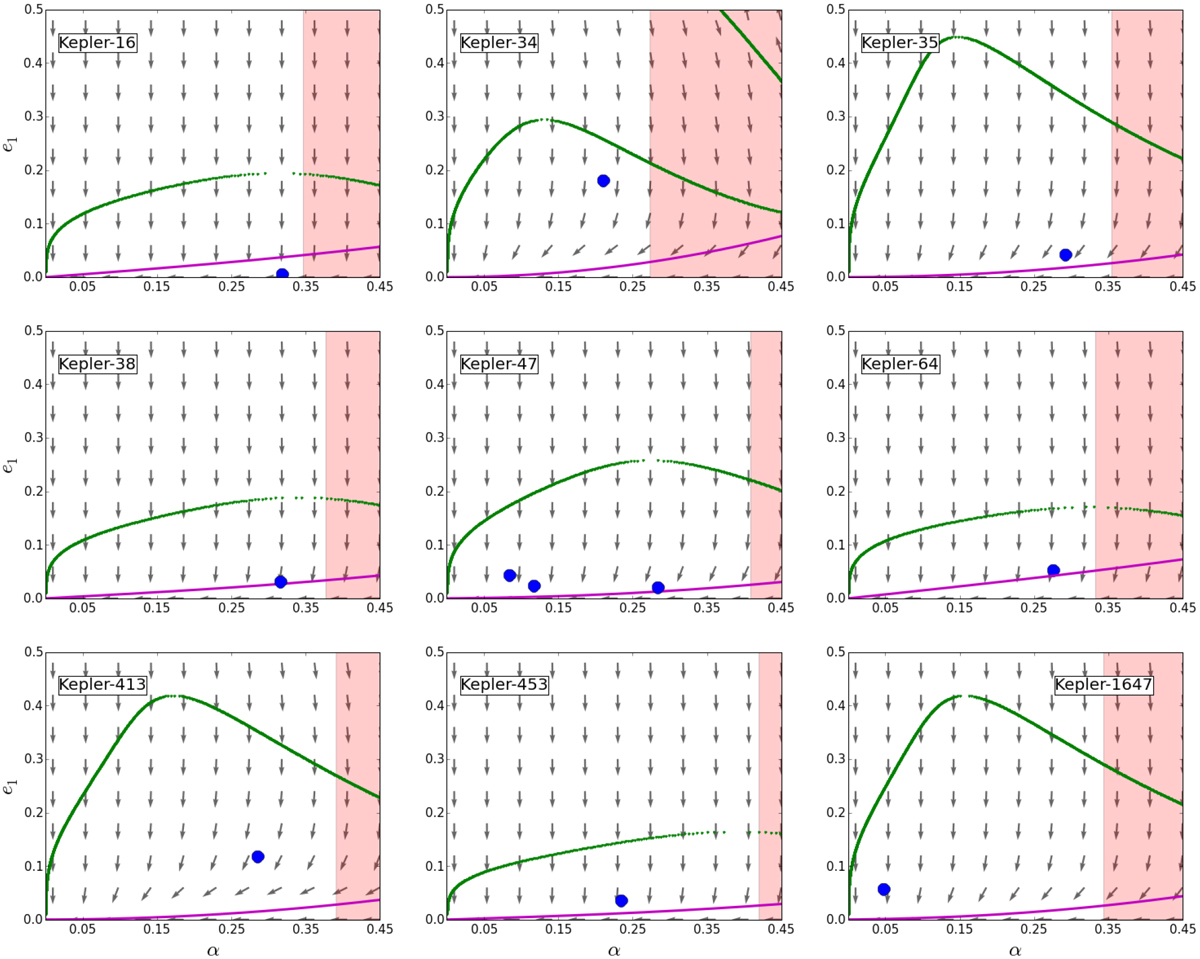
Velocity vector fields in the (α, e2) plane depicting the routes of tidal evolution in the vicinity of each Kepler CBP. The arrows show the direction of orbital evolution throughout the plane, although its size was kept constant and is thus not representative of the magnitude of the derivatives. The green curves corresponds to
![]() ) while the magenta curves indicate the location of the capture eccentricity ecap
as defined by Eq. (26). The pale pink region correspond to values of the orbital elements identified as unstable according to the criterion by Holman & Wiegert (1999). Current positions of the Kepler CBPs are shown in blue circles.
) while the magenta curves indicate the location of the capture eccentricity ecap
as defined by Eq. (26). The pale pink region correspond to values of the orbital elements identified as unstable according to the criterion by Holman & Wiegert (1999). Current positions of the Kepler CBPs are shown in blue circles.
Current usage metrics show cumulative count of Article Views (full-text article views including HTML views, PDF and ePub downloads, according to the available data) and Abstracts Views on Vision4Press platform.
Data correspond to usage on the plateform after 2015. The current usage metrics is available 48-96 hours after online publication and is updated daily on week days.
Initial download of the metrics may take a while.