Fig. 5.
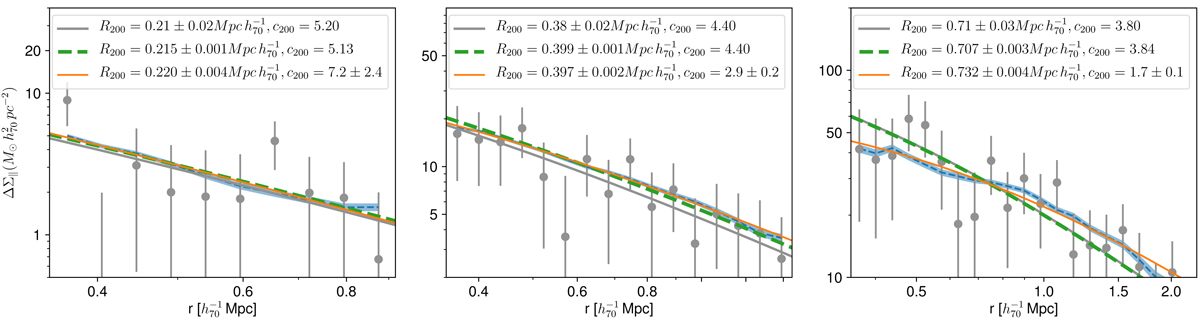
Average density contrast profiles for three halo mass bins, from left to right, lmhalo ∈ [12.10,12.30), [12.90,13.10), and [13.70,13.90) log(M/M⊙). The density contrast derived from the noise-free source sample is shown in blue, the best-fit NFW obtained fitting c200 (solid orange line), and fixing it using the relation of Duffy et al. (2008) (dashed green line). Gray points correspond to profiles obtained according to the noisy source sample, and the corresponding best-fit NFW is plotted as the solid gray line. h70 corresponds to h = 0.7.
Current usage metrics show cumulative count of Article Views (full-text article views including HTML views, PDF and ePub downloads, according to the available data) and Abstracts Views on Vision4Press platform.
Data correspond to usage on the plateform after 2015. The current usage metrics is available 48-96 hours after online publication and is updated daily on week days.
Initial download of the metrics may take a while.