Free Access
Fig. 4.
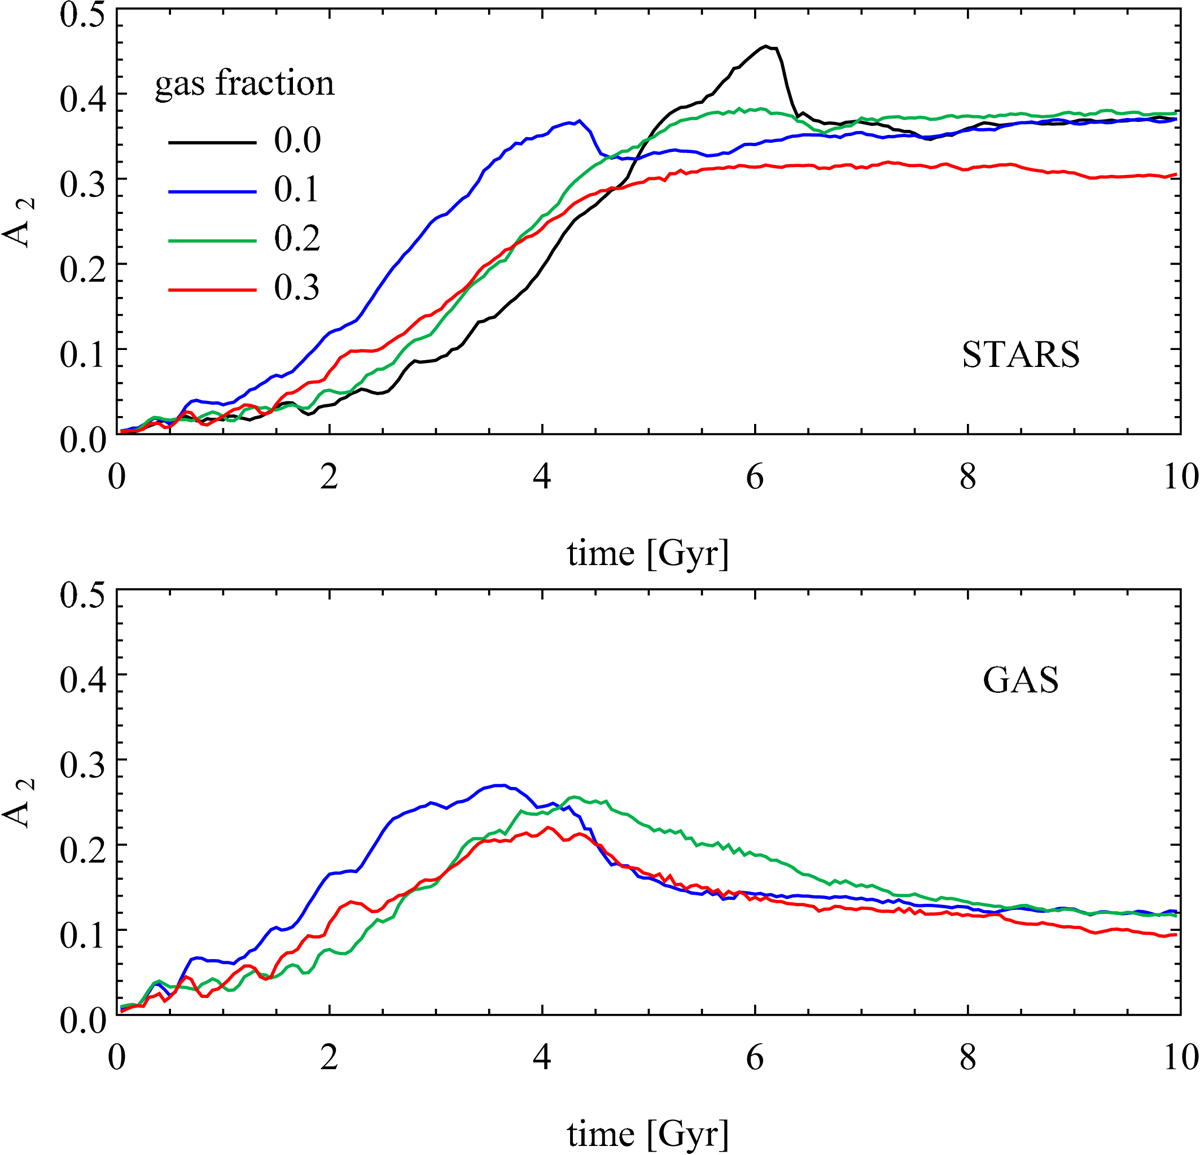
Evolution of the bar mode A2 for the stellar component (upper panel) and the gas (lower panel). The measurements were performed within 2RD, that is, the bar mode here is a single value A2 = A2(<2RD). Lines of different colors correspond to different gas fractions.
Current usage metrics show cumulative count of Article Views (full-text article views including HTML views, PDF and ePub downloads, according to the available data) and Abstracts Views on Vision4Press platform.
Data correspond to usage on the plateform after 2015. The current usage metrics is available 48-96 hours after online publication and is updated daily on week days.
Initial download of the metrics may take a while.