Free Access
Fig. 12.
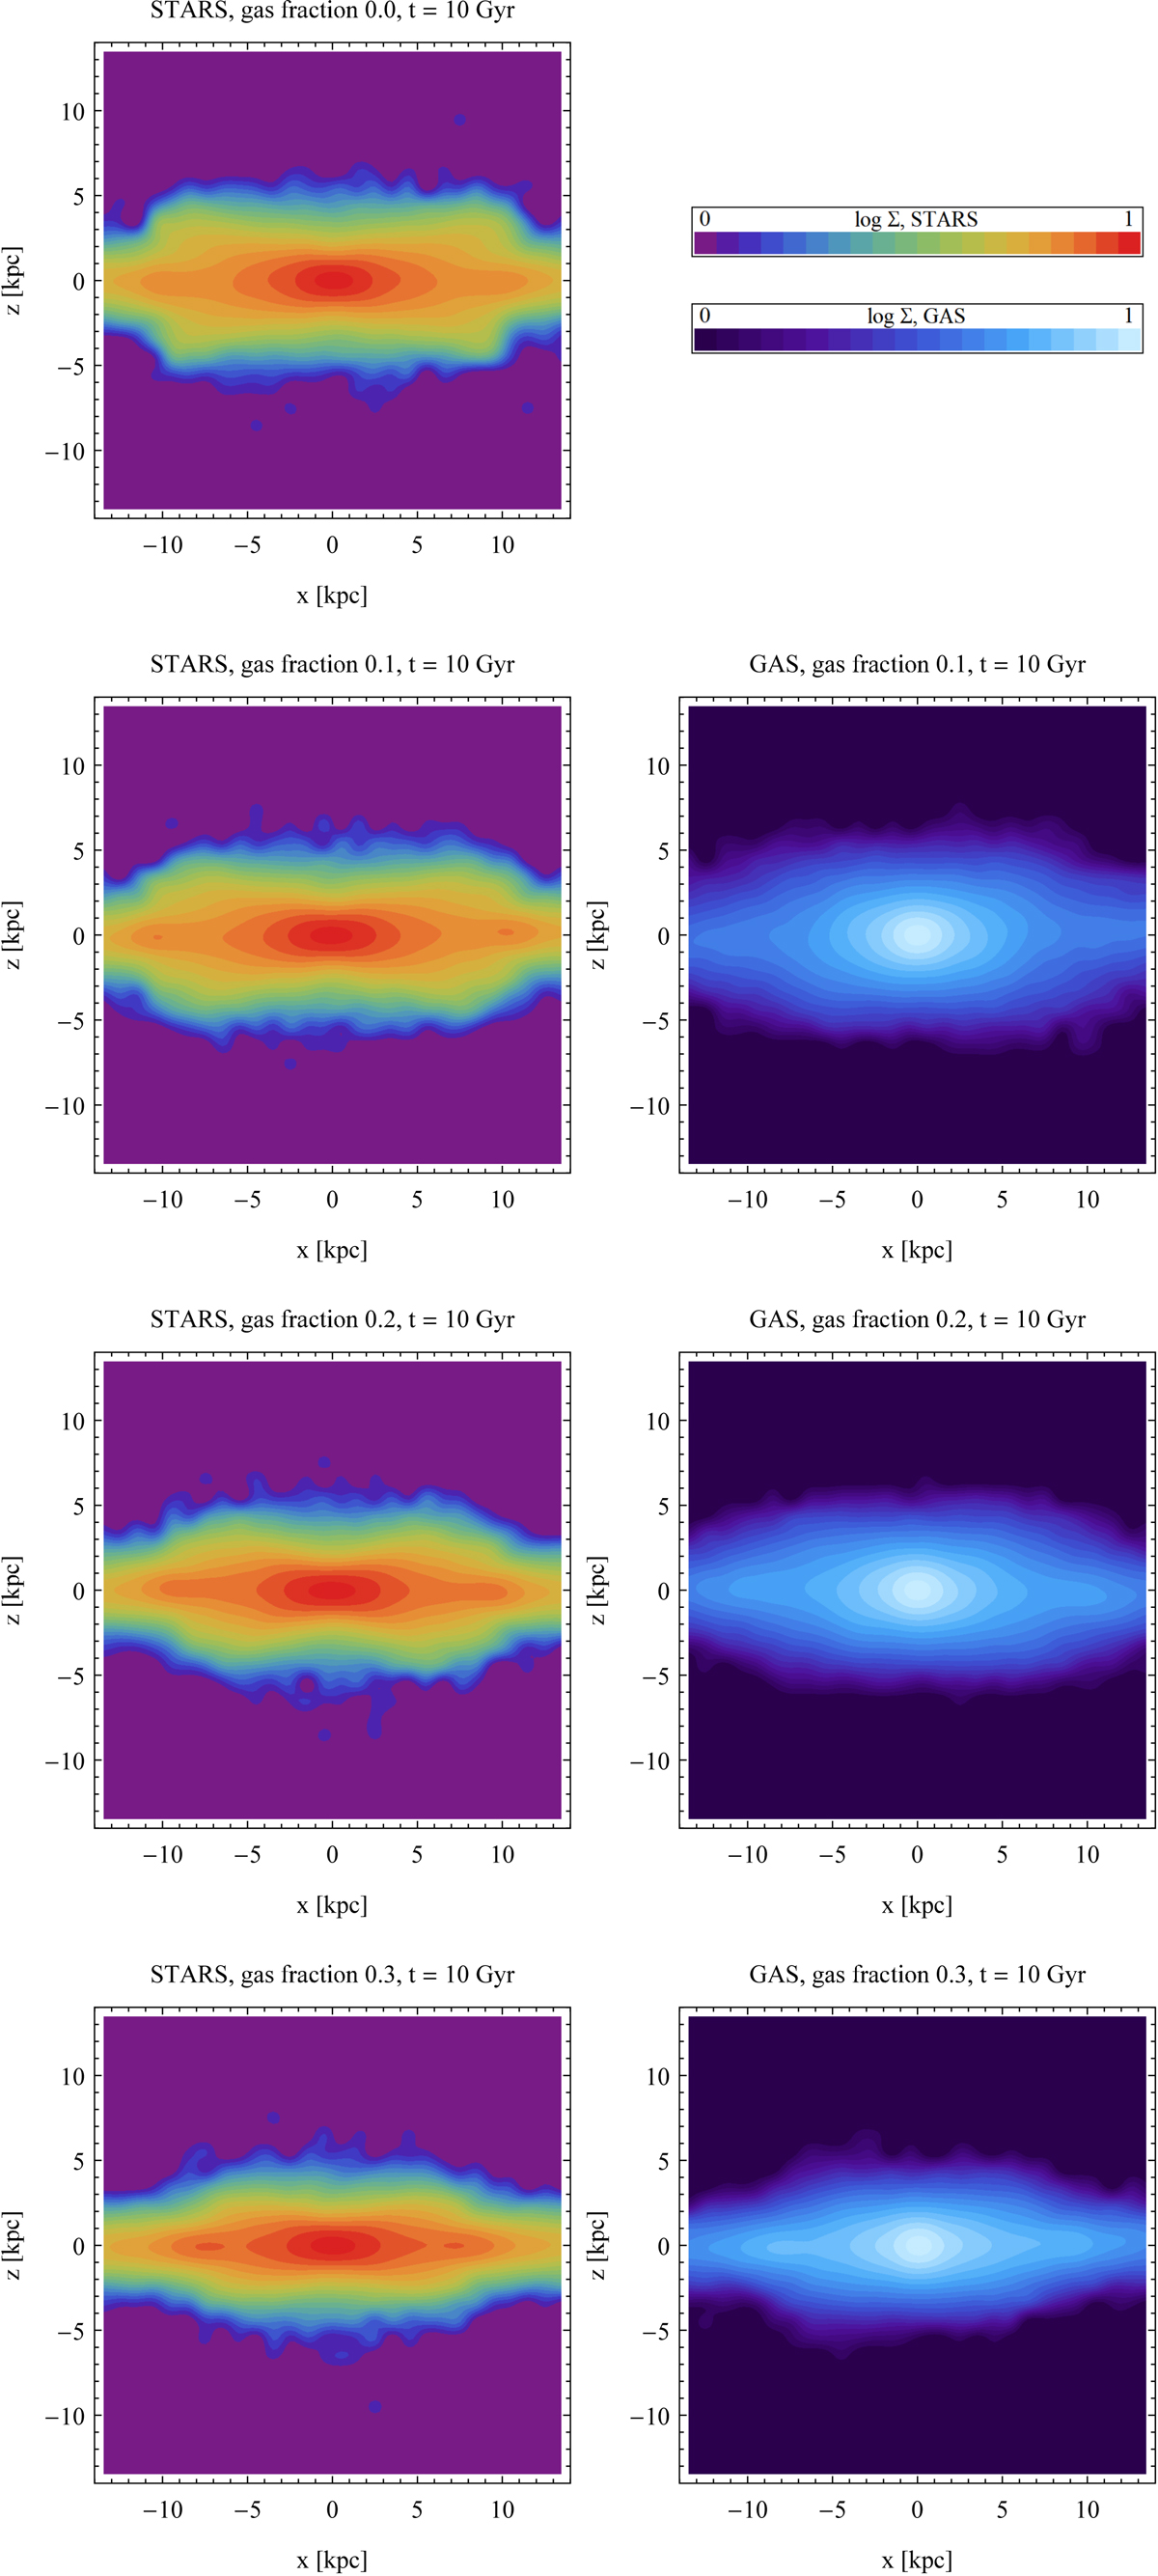
Surface density distributions of stars and gas in the edge-on view at the end of the simulations, after 10 Gyr. Rows show the images from simulations with an increasing gas fraction. Left column: stars, right column: gas. The surface density was normalized to the central value in each case.
Current usage metrics show cumulative count of Article Views (full-text article views including HTML views, PDF and ePub downloads, according to the available data) and Abstracts Views on Vision4Press platform.
Data correspond to usage on the plateform after 2015. The current usage metrics is available 48-96 hours after online publication and is updated daily on week days.
Initial download of the metrics may take a while.