Free Access
Fig. 9.
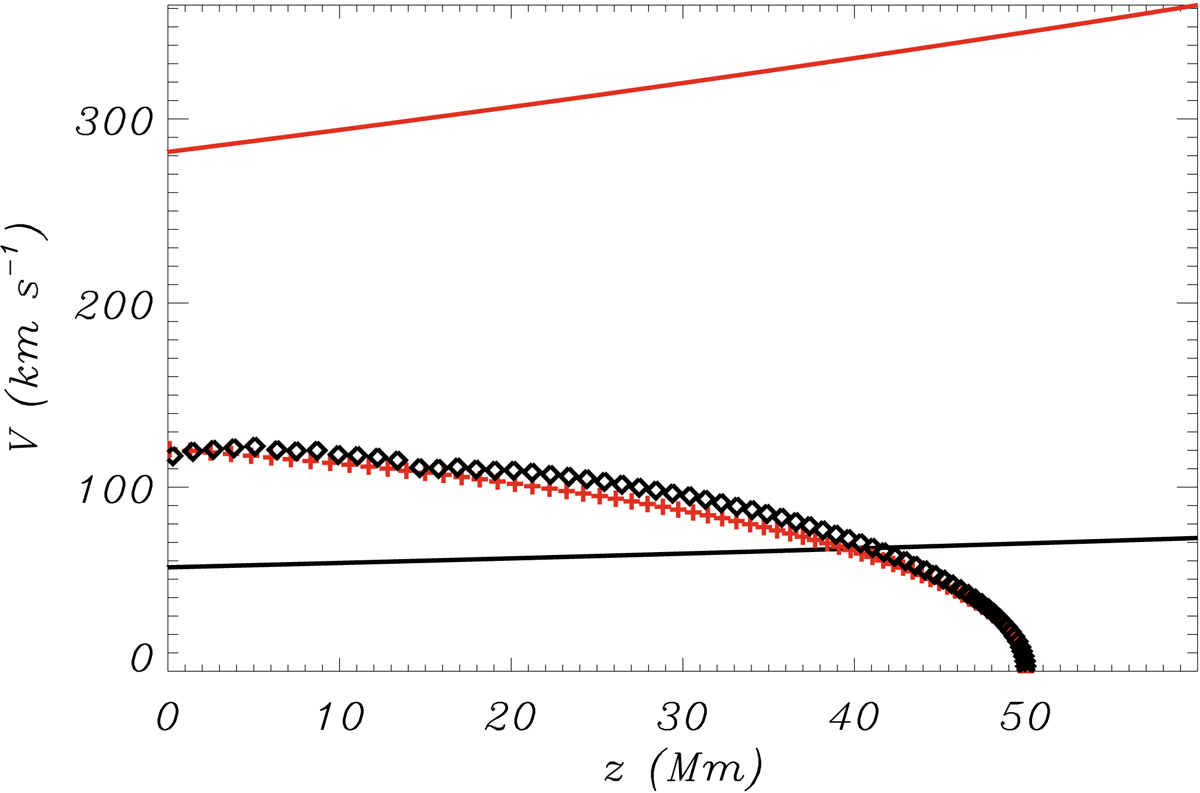
|Vfall| and VKHI as functions of height. Lines represent VKHI and symbols represent the falling speed of blobs in simulations with ρb0 = 10−9 kg m−3. Red colour corresponds to the case with B0 = 5 G while black corresponds to B0 = 1 G.
Current usage metrics show cumulative count of Article Views (full-text article views including HTML views, PDF and ePub downloads, according to the available data) and Abstracts Views on Vision4Press platform.
Data correspond to usage on the plateform after 2015. The current usage metrics is available 48-96 hours after online publication and is updated daily on week days.
Initial download of the metrics may take a while.