Fig. 3.
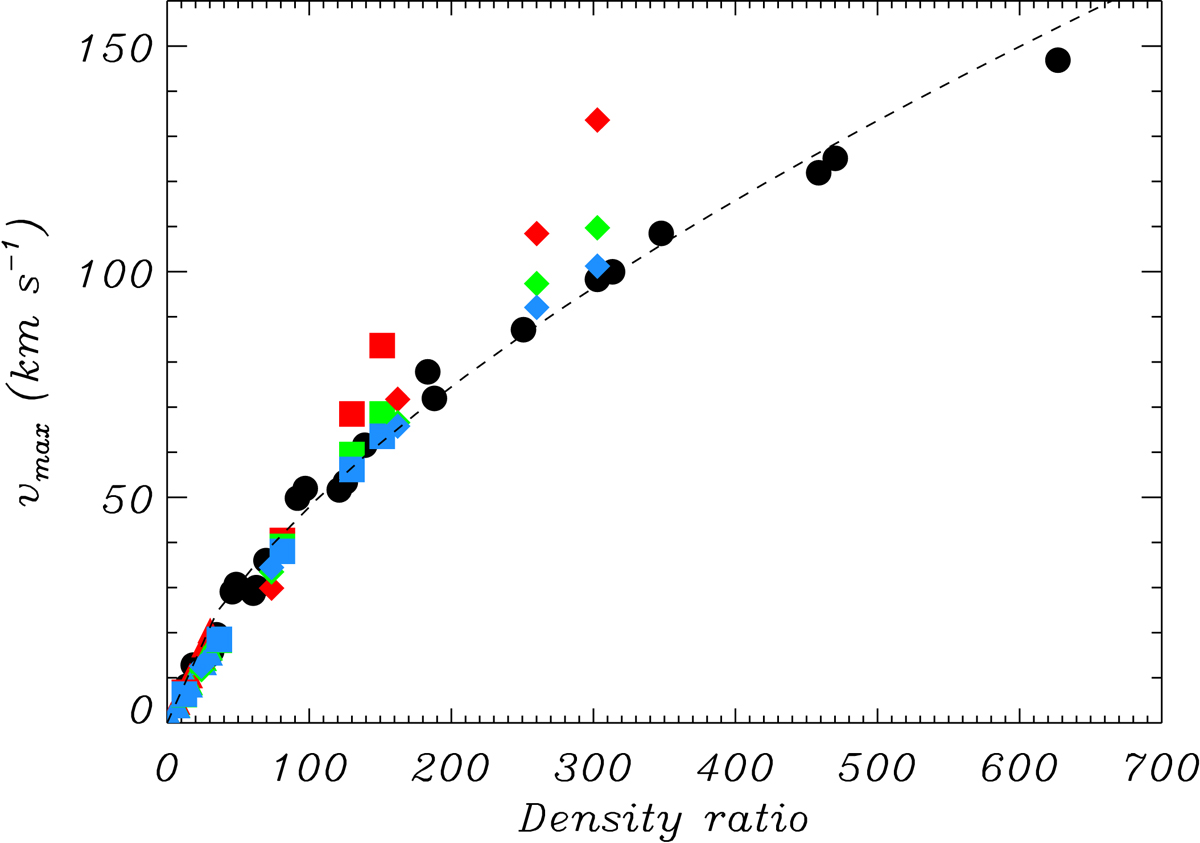
Maximum falling speed as a function of density ratio. Black circles correspond to the results from 1D simulations. Triangles, squares and diamonds show the results of 2D simulations with ρb0 = 1, 5 and 10 × 10−10 kg m−3, respectively. Red, green and blue colour correspond to the cases with B0 = 5, 10 and 20 G, respectively.
Current usage metrics show cumulative count of Article Views (full-text article views including HTML views, PDF and ePub downloads, according to the available data) and Abstracts Views on Vision4Press platform.
Data correspond to usage on the plateform after 2015. The current usage metrics is available 48-96 hours after online publication and is updated daily on week days.
Initial download of the metrics may take a while.