Free Access
Fig. 2.
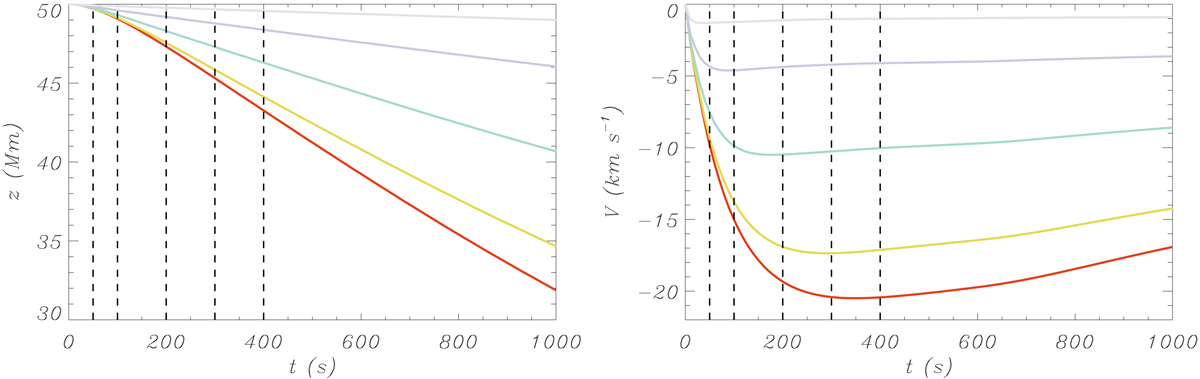
Left panel: position as a function of time of selected points from simulation I-5. Right panel: velocity as a function of time. Vertical dashed lines represent the time of the snapshots displayed in Fig. 1. The colours of the lines are related to the density scale shown in the previous figure.
Current usage metrics show cumulative count of Article Views (full-text article views including HTML views, PDF and ePub downloads, according to the available data) and Abstracts Views on Vision4Press platform.
Data correspond to usage on the plateform after 2015. The current usage metrics is available 48-96 hours after online publication and is updated daily on week days.
Initial download of the metrics may take a while.