Fig. 6.
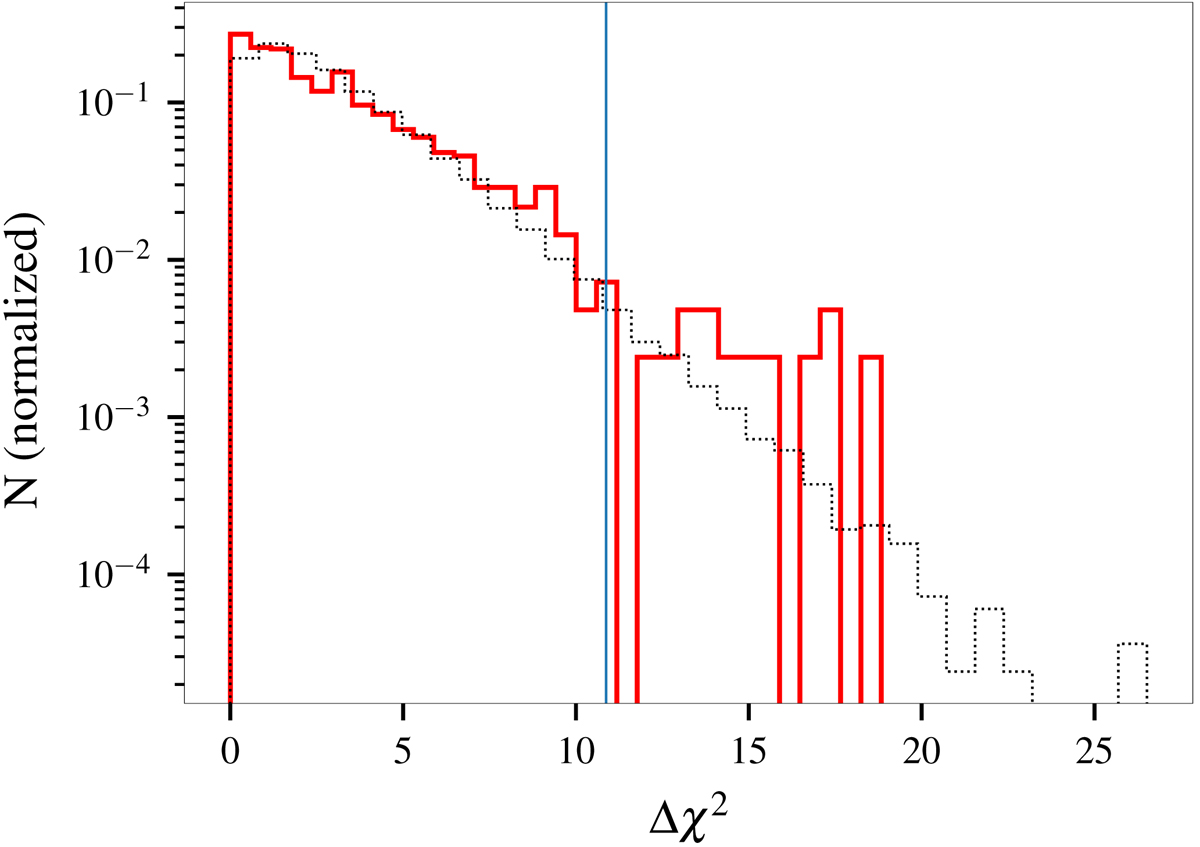
Distribution of obtained fit improvements (Δχ2) when fitting simulated spectra including no line with a model including the line (red). The expected chance improvement (for χ2 distribution with three degrees of freedom) is also plotted for reference (black dots). The largest improvement obtained from the observed data (10.87) is indicated by a vertical line and corresponds to a chance probability of ∼1.2%.
Current usage metrics show cumulative count of Article Views (full-text article views including HTML views, PDF and ePub downloads, according to the available data) and Abstracts Views on Vision4Press platform.
Data correspond to usage on the plateform after 2015. The current usage metrics is available 48-96 hours after online publication and is updated daily on week days.
Initial download of the metrics may take a while.