Free Access
Fig. 5.
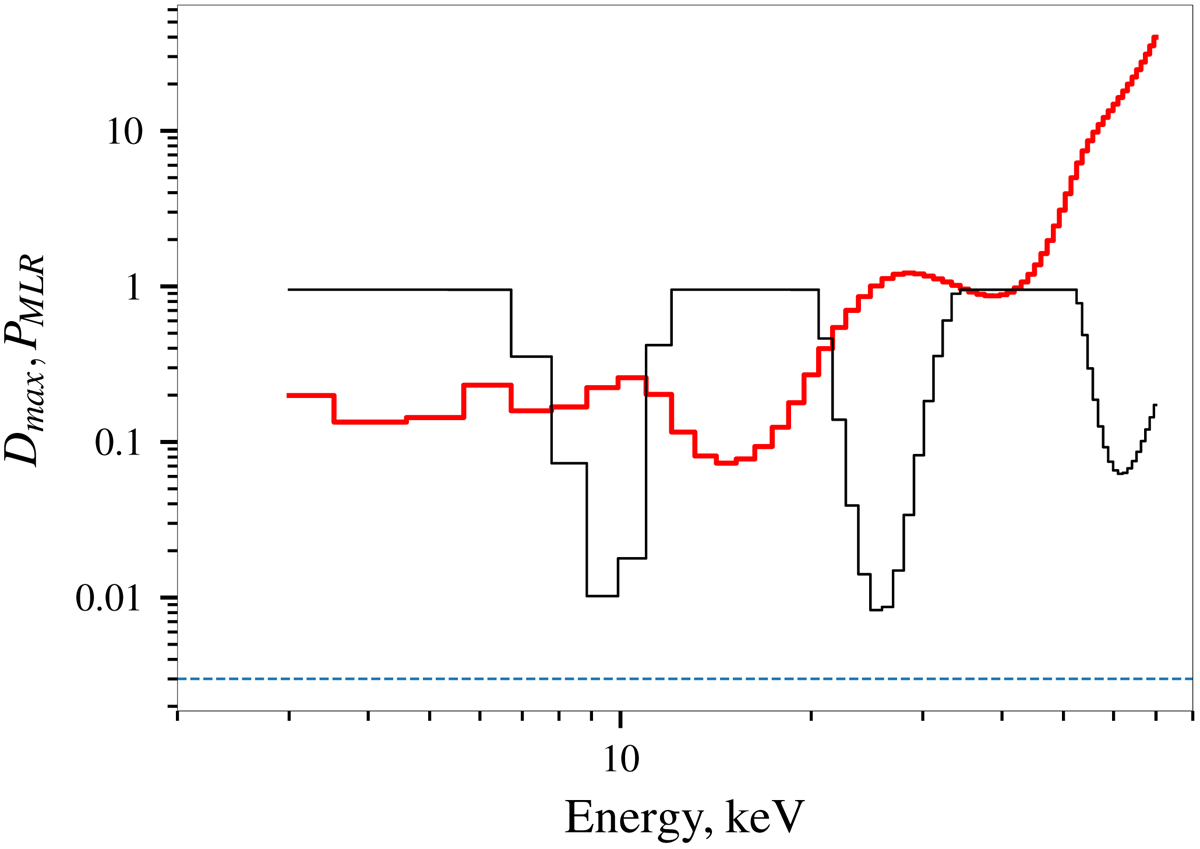
Upper limit for depth of the potential CRSF (red) and corresponding f-test chance probability of fit improvement (black) as function of energy. The thin horizontal line indicates a 3σ confidence level for line detection.
Current usage metrics show cumulative count of Article Views (full-text article views including HTML views, PDF and ePub downloads, according to the available data) and Abstracts Views on Vision4Press platform.
Data correspond to usage on the plateform after 2015. The current usage metrics is available 48-96 hours after online publication and is updated daily on week days.
Initial download of the metrics may take a while.