Free Access
Fig. 4.
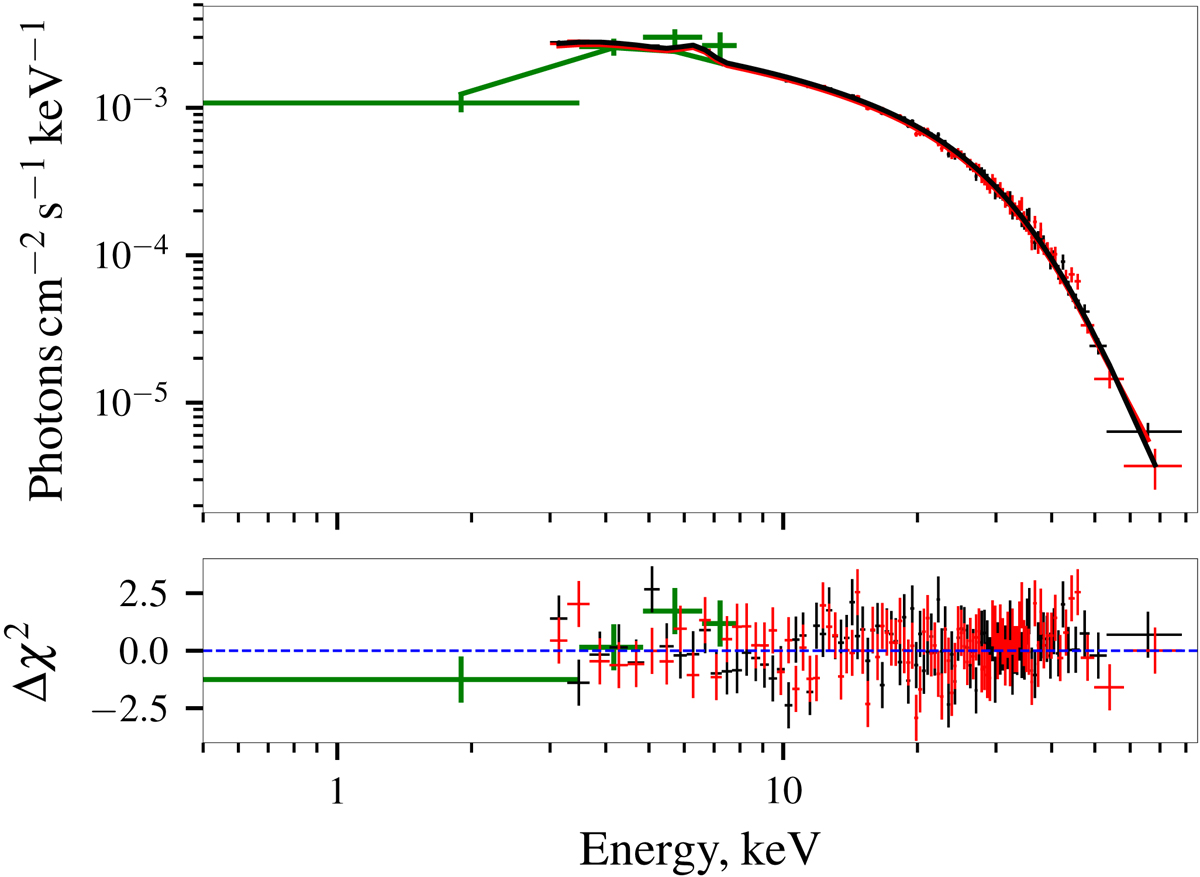
Unfolded spectrum assuming best-fit FDCUT continuum as observed by Swift/XRT (green), and NuSTAR (black for FPMA and red for FPMB). The lower panel shows corresponding residuals.
Current usage metrics show cumulative count of Article Views (full-text article views including HTML views, PDF and ePub downloads, according to the available data) and Abstracts Views on Vision4Press platform.
Data correspond to usage on the plateform after 2015. The current usage metrics is available 48-96 hours after online publication and is updated daily on week days.
Initial download of the metrics may take a while.