Fig. 2.
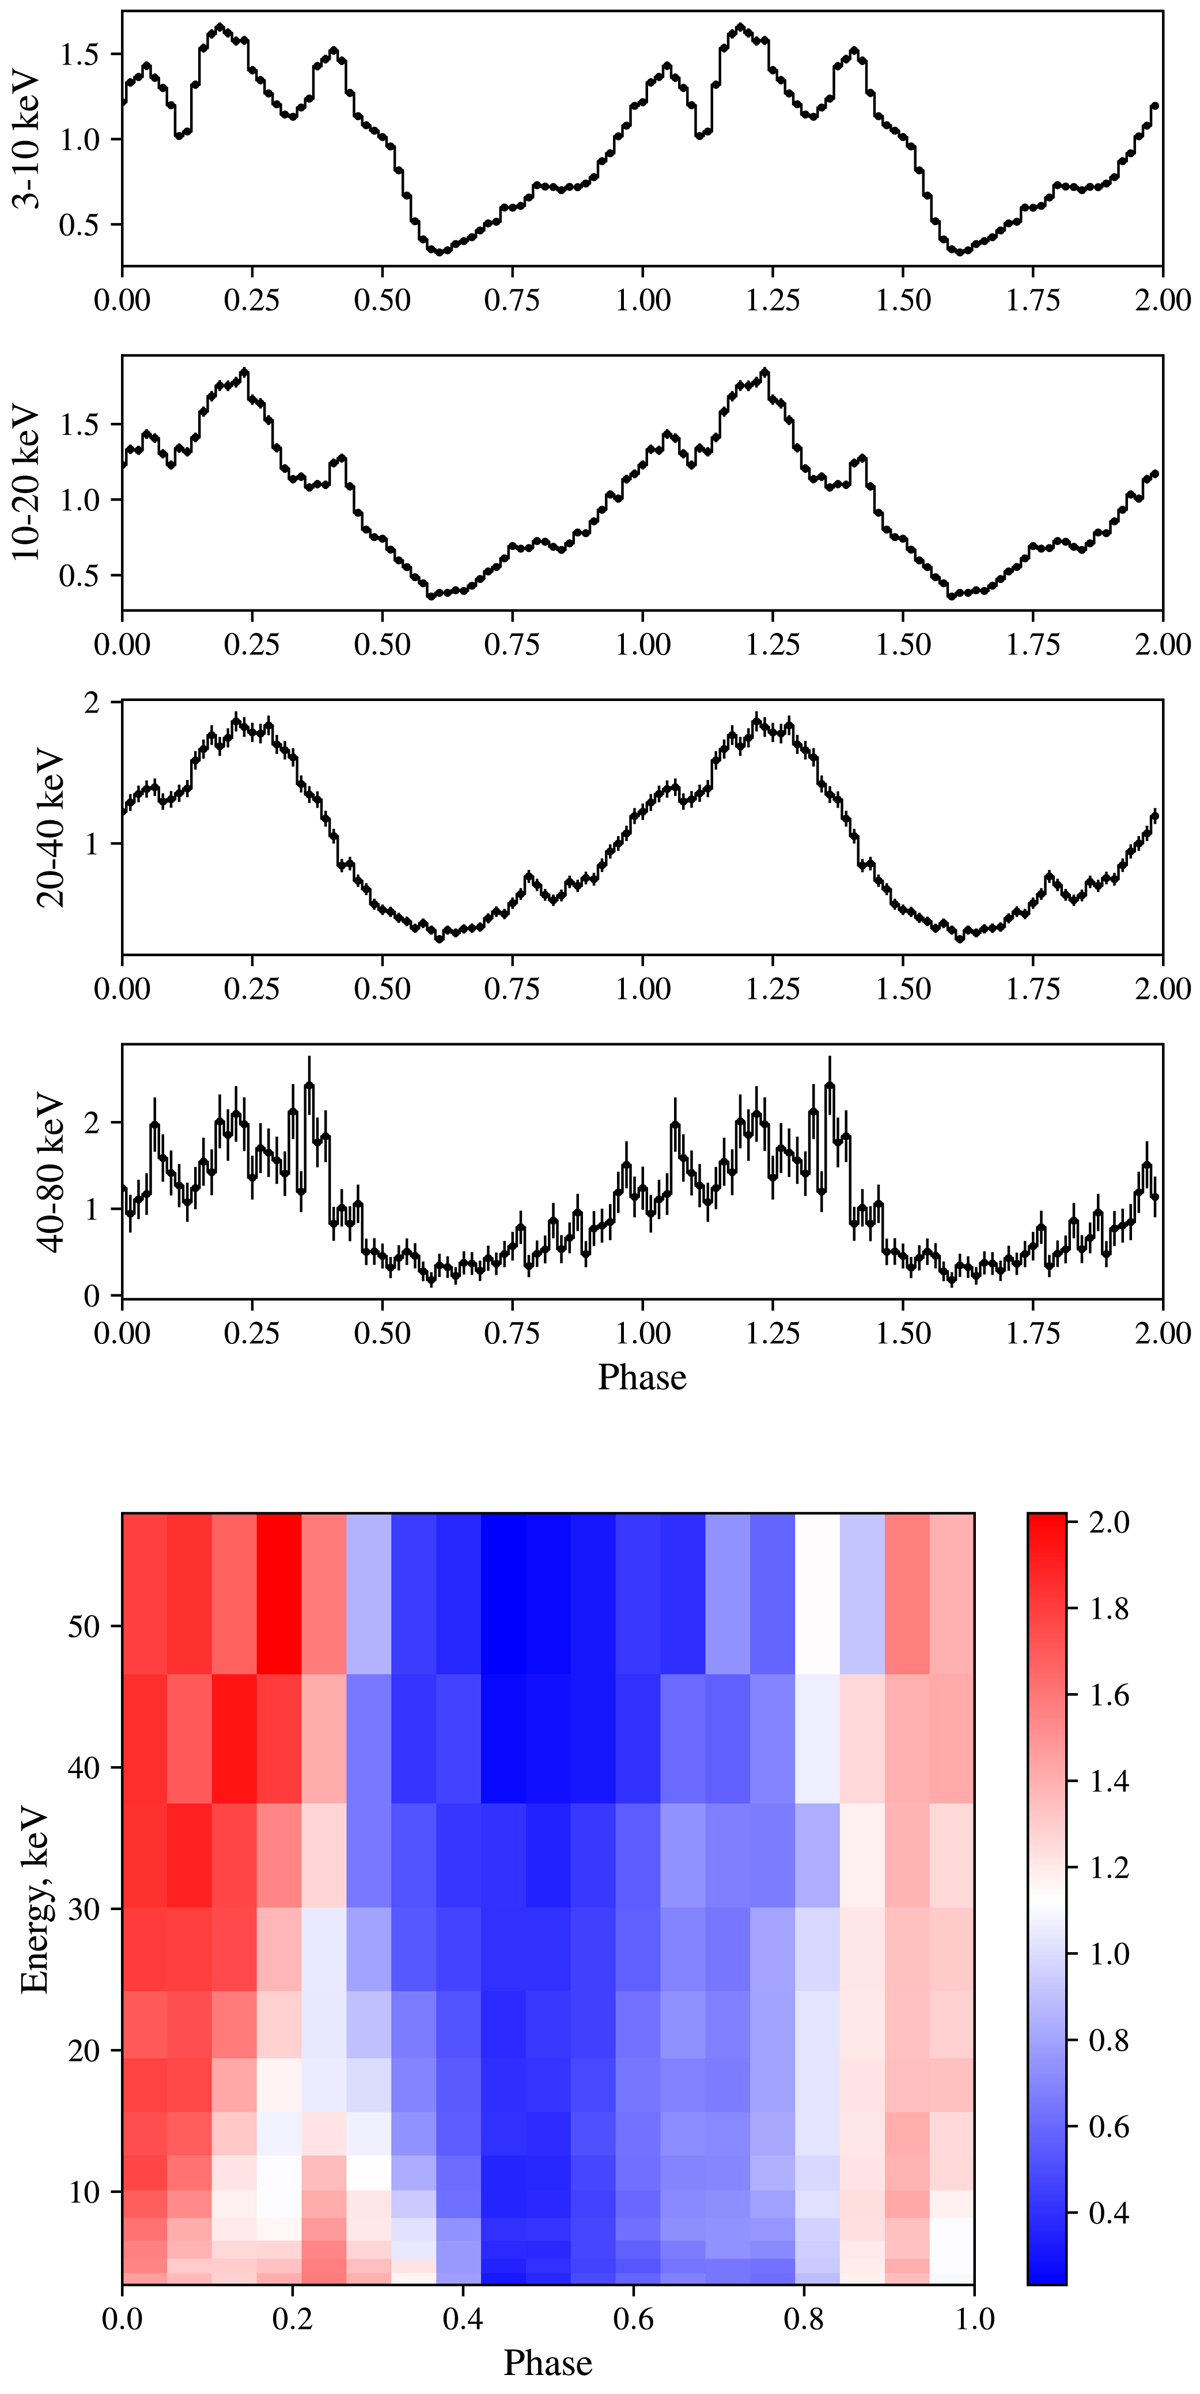
Representative pulse profiles of source normalized by dividing by the average source intensity in the frame using efold task as observed by NuSTAR in several energy bands (top), and the phase-energy matrix showing the energy evolution of the (normalized) pulse profiles in details (bottom). In the latter case, slices along the constant energy represent normalized pulse profiles similar to those shown in the top panel. We note the energy dependence of pulse profile shape, particularly around ∼15 keV.
Current usage metrics show cumulative count of Article Views (full-text article views including HTML views, PDF and ePub downloads, according to the available data) and Abstracts Views on Vision4Press platform.
Data correspond to usage on the plateform after 2015. The current usage metrics is available 48-96 hours after online publication and is updated daily on week days.
Initial download of the metrics may take a while.