Fig. 1.
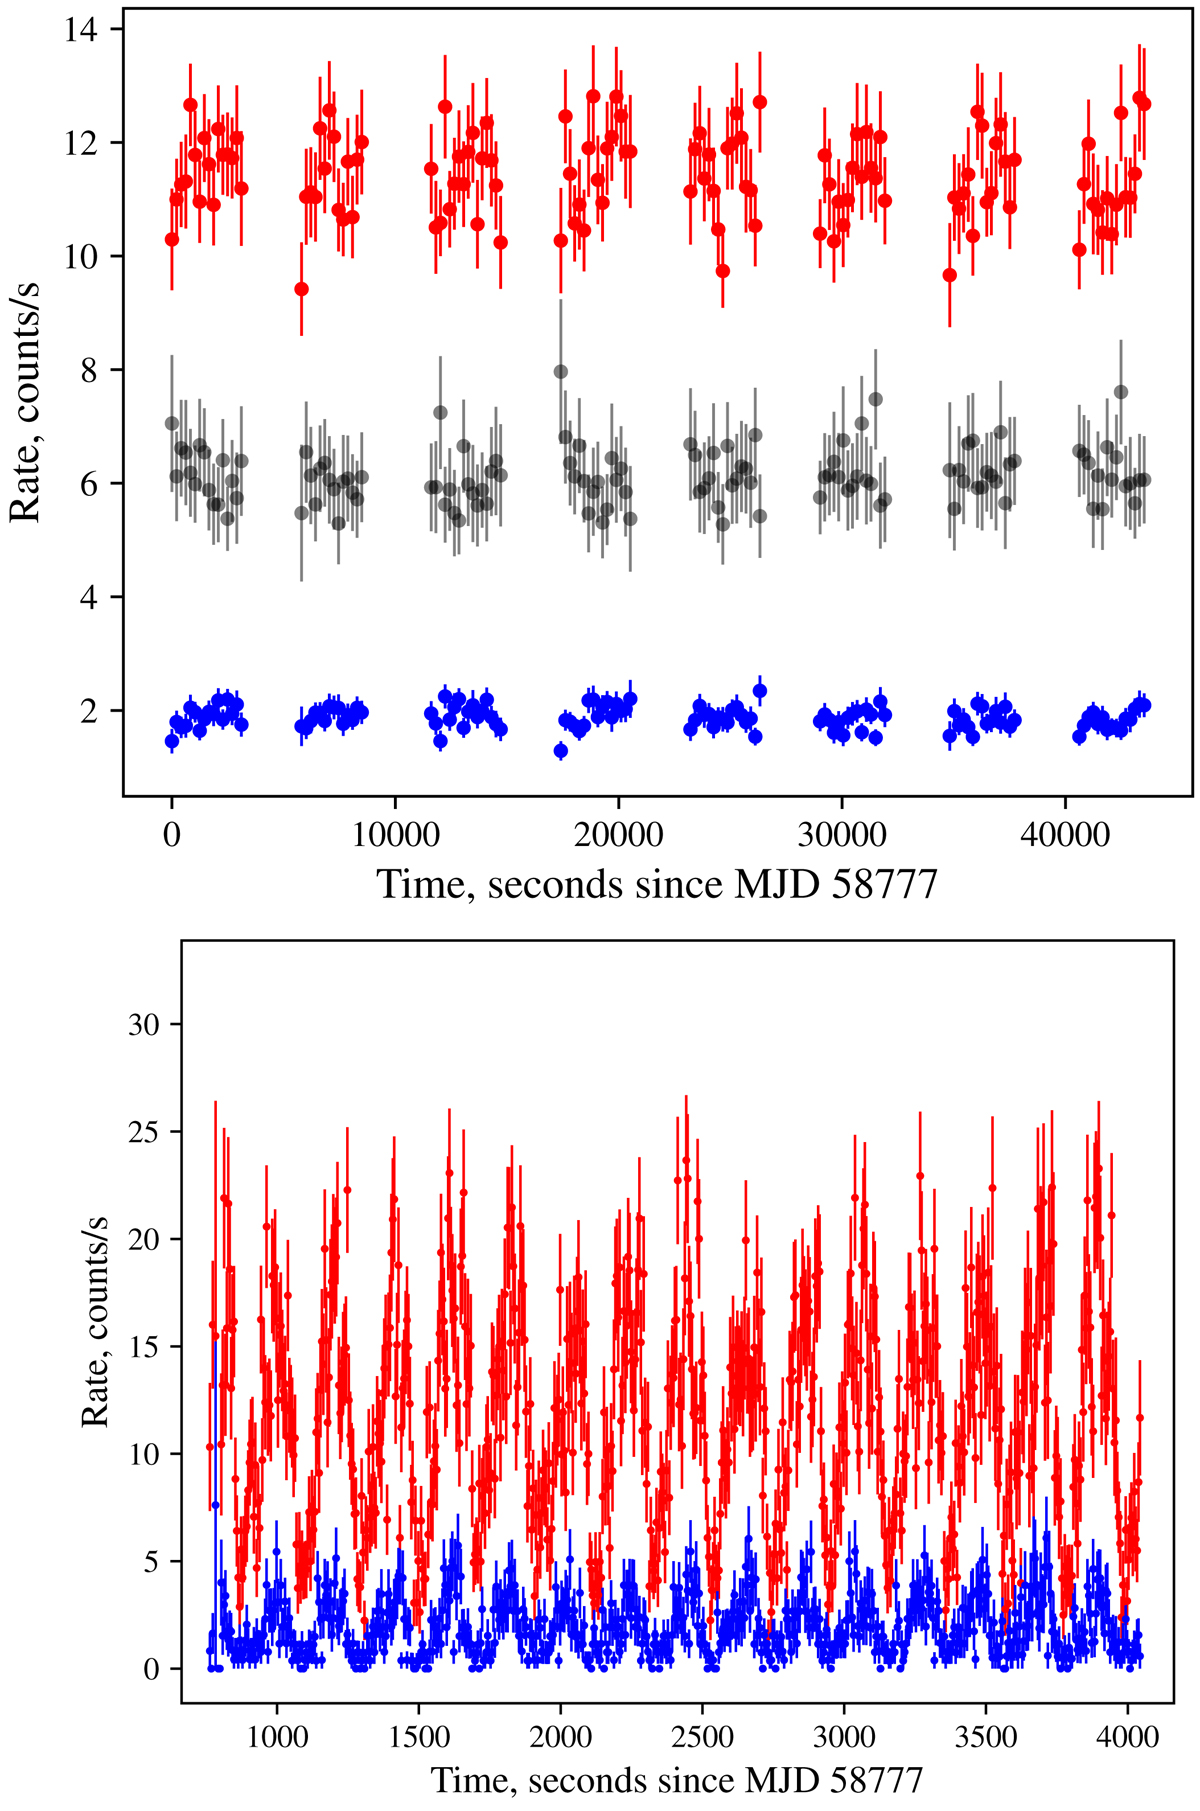
Light curve of the source as observed by NuSTAR in 3–10 keV (red) and 20–40 keV (blue) bands (top, both units combined, one bin per pulse), and the ratio of the two (black points). Bottom panel: part of the light curve of the source in the 3–10 keV (red) and 20–40 keV (blue) bands. Strong pulsations with a period of ∼200 s are observed throughout the full energy range.
Current usage metrics show cumulative count of Article Views (full-text article views including HTML views, PDF and ePub downloads, according to the available data) and Abstracts Views on Vision4Press platform.
Data correspond to usage on the plateform after 2015. The current usage metrics is available 48-96 hours after online publication and is updated daily on week days.
Initial download of the metrics may take a while.