Fig. 4.
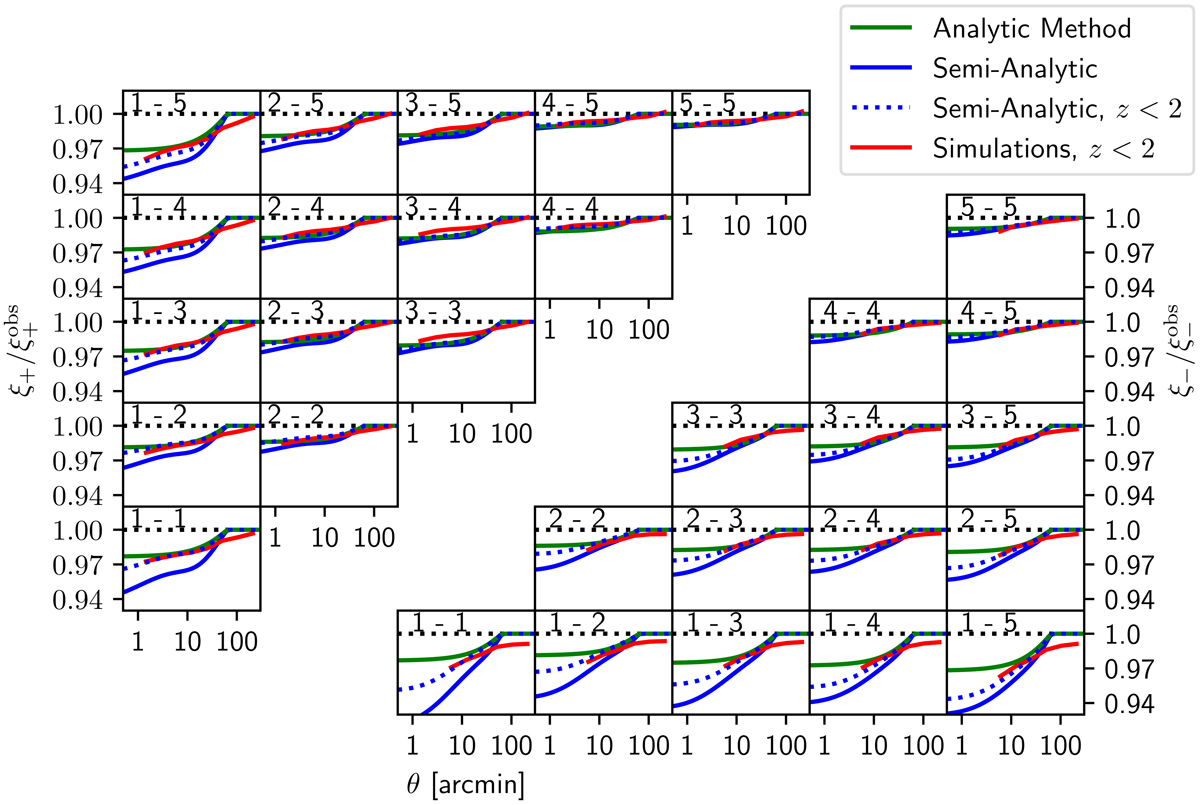
Ratio of correlation functions measured for a uniform depth survey, ξ±, and a KiDS-like variable depth survey, ![]() , cross-correlating five tomographic bins (as denoted in the upper left corner of each panel). The upper left triangle depicts the ratios of ξ+, whereas the lower right triangle depicts the ratios of ξ−. Results from mock KiDS-like data (red) can be compared to analytic models from Sect. 2 (average redshift weighting, green), and the semi-analytic model from Sect. 3 (blue solid). Mock data is limited to the angular regime which is not significantly impacted by resolution effects. As the mocks only take galaxies with z < 2 into account, they slightly underestimate the effect. Applying the same redshift-cutoff to the semi-analytical model (blue dashed) yields a near-perfect agreement on sub-pointing scales. Therefore, the seemingly better agreement between the mocks and the analytic method is purely coincidental. The models adopt the best-fit cosmology of H20.
, cross-correlating five tomographic bins (as denoted in the upper left corner of each panel). The upper left triangle depicts the ratios of ξ+, whereas the lower right triangle depicts the ratios of ξ−. Results from mock KiDS-like data (red) can be compared to analytic models from Sect. 2 (average redshift weighting, green), and the semi-analytic model from Sect. 3 (blue solid). Mock data is limited to the angular regime which is not significantly impacted by resolution effects. As the mocks only take galaxies with z < 2 into account, they slightly underestimate the effect. Applying the same redshift-cutoff to the semi-analytical model (blue dashed) yields a near-perfect agreement on sub-pointing scales. Therefore, the seemingly better agreement between the mocks and the analytic method is purely coincidental. The models adopt the best-fit cosmology of H20.
Current usage metrics show cumulative count of Article Views (full-text article views including HTML views, PDF and ePub downloads, according to the available data) and Abstracts Views on Vision4Press platform.
Data correspond to usage on the plateform after 2015. The current usage metrics is available 48-96 hours after online publication and is updated daily on week days.
Initial download of the metrics may take a while.