Free Access
Fig. 3.
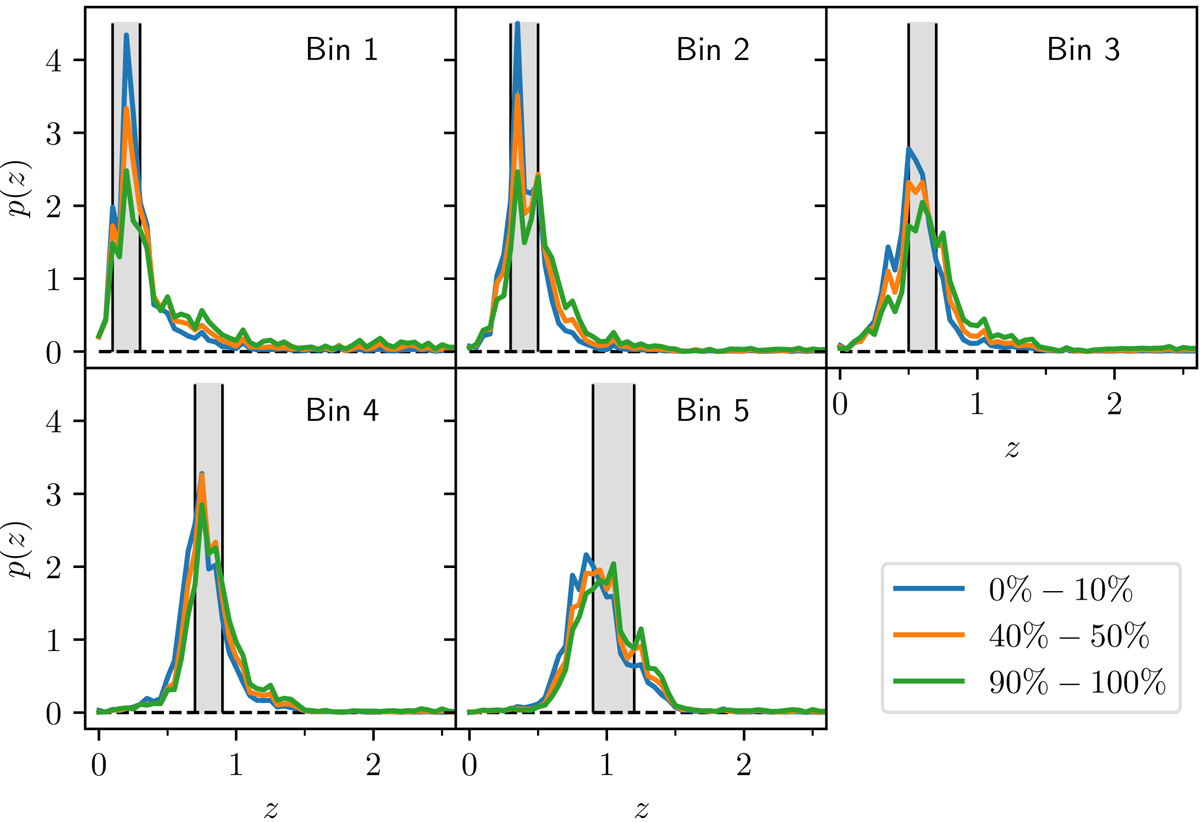
Source redshift distributions ![]() for a selection of very shallow pointings (blue), average pointings (yellow) and very deep pointings (green). The percentage points in the legend denote to which quantile a pointing belongs, when all are ordered by their depth.
for a selection of very shallow pointings (blue), average pointings (yellow) and very deep pointings (green). The percentage points in the legend denote to which quantile a pointing belongs, when all are ordered by their depth.
Current usage metrics show cumulative count of Article Views (full-text article views including HTML views, PDF and ePub downloads, according to the available data) and Abstracts Views on Vision4Press platform.
Data correspond to usage on the plateform after 2015. The current usage metrics is available 48-96 hours after online publication and is updated daily on week days.
Initial download of the metrics may take a while.