Fig. 2.
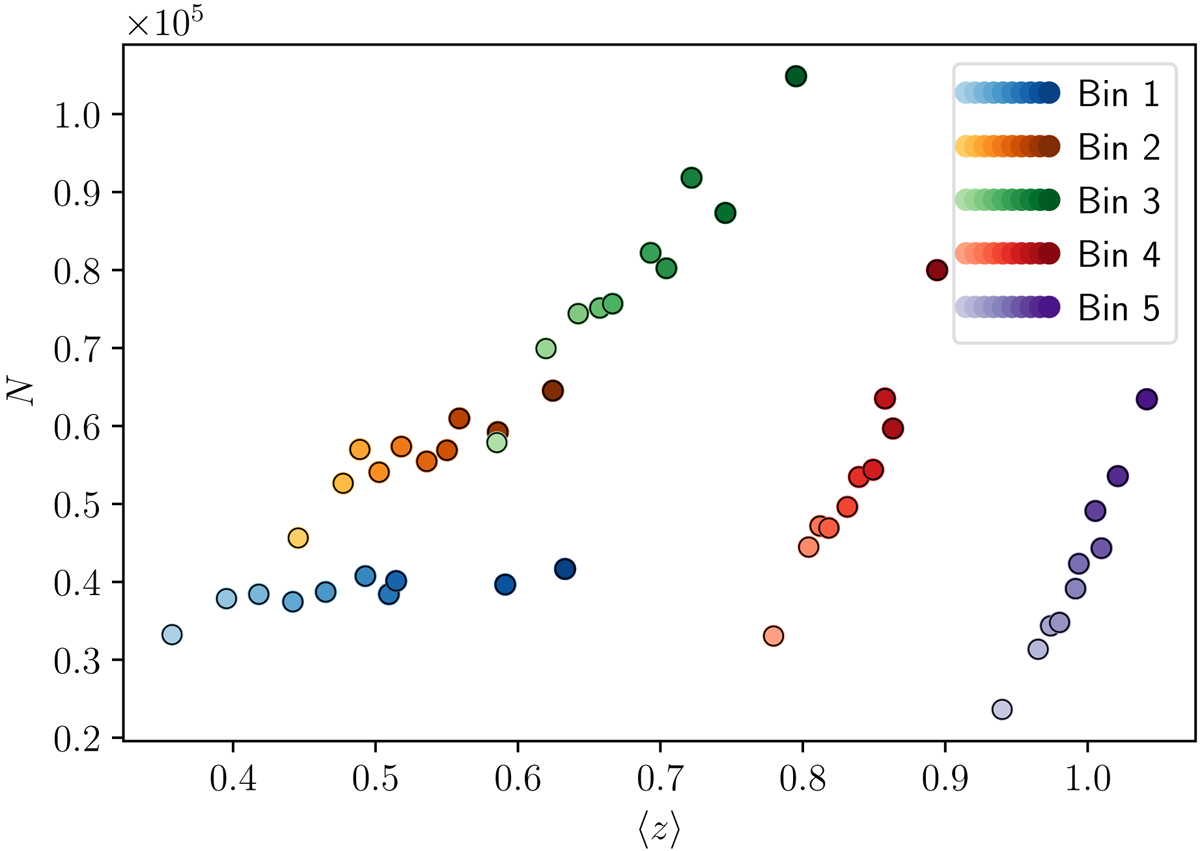
Weighted number of galaxies N and average redshift ⟨z⟩ in the KiDS+VIKING-450 survey (KV450, Wright et al. 2019) in pointings of different depth for each of the five tomographic bins used in H20. Each color corresponds to one redshift bin of H20. A single point represents one quantile of the respective redshift bin, where the fainter points denote pointings of shallower depth.
Current usage metrics show cumulative count of Article Views (full-text article views including HTML views, PDF and ePub downloads, according to the available data) and Abstracts Views on Vision4Press platform.
Data correspond to usage on the plateform after 2015. The current usage metrics is available 48-96 hours after online publication and is updated daily on week days.
Initial download of the metrics may take a while.