Fig. 2.
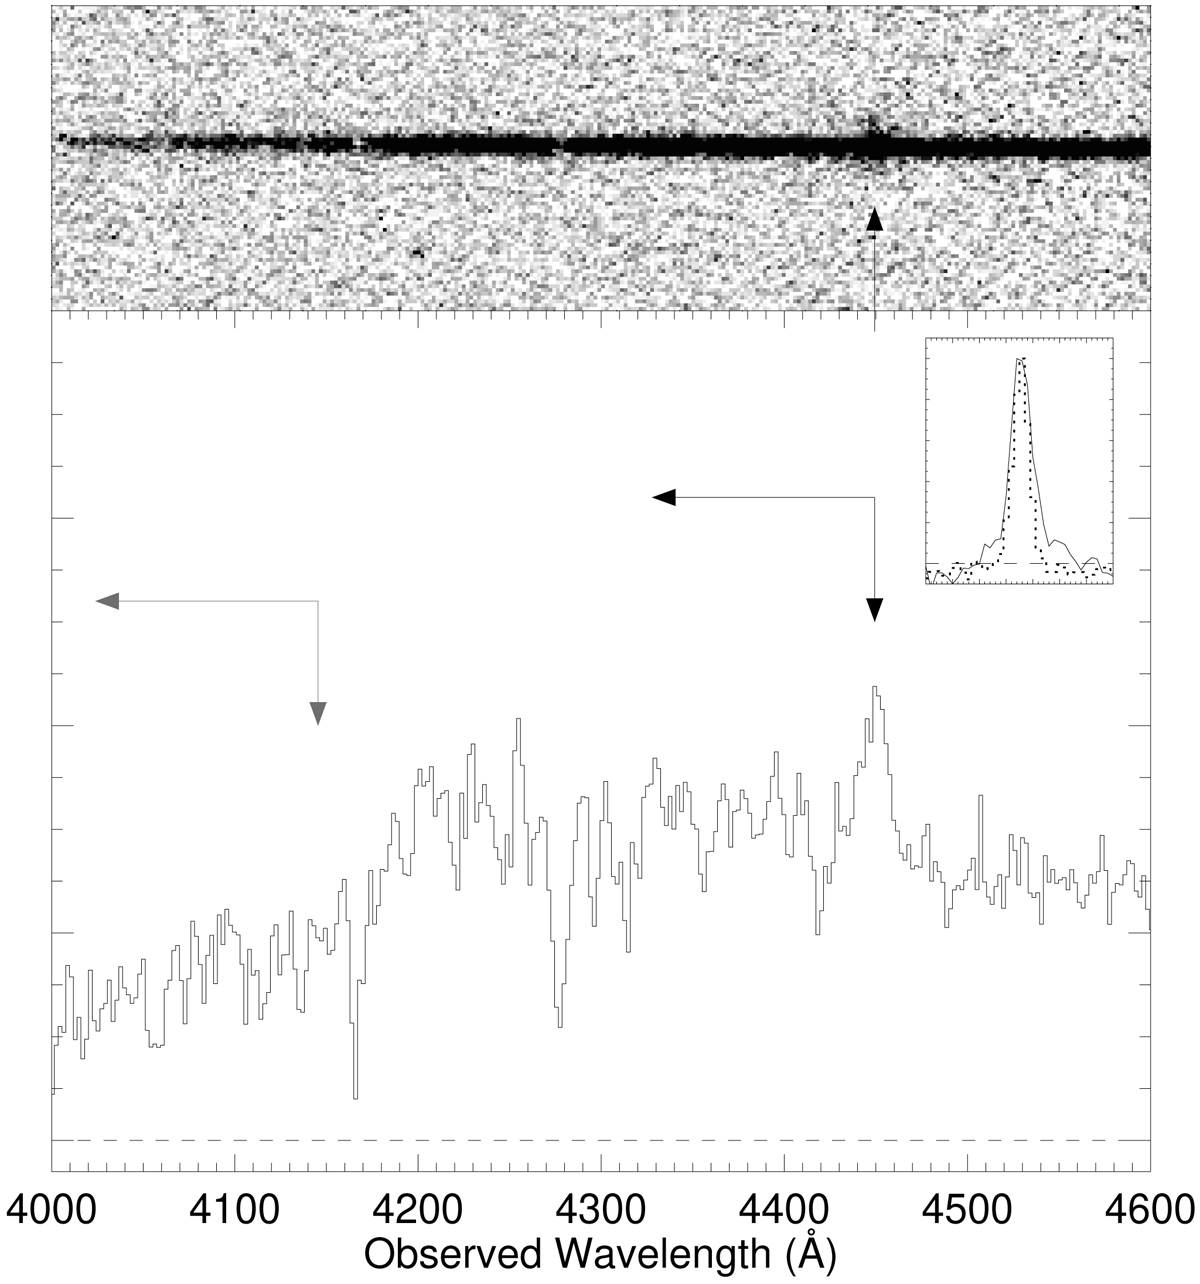
Zoom-in on blue part of the spectrum both in the 2D spectrum (top panel) and 1D spectrum (bottom panel). The black arrows indicate the location of the spatially extended emission line, which we interpret as Lyman-α emission with a FWHM of ≈1200 km s−1, and the start of the Lyman-α forest at z = 2.66. There are several narrow absorption lines shortwards of the alleged Lyman-α line, which would be consistent with the onset of the Lyman-α forest. If the redshift was z = 2.41, then the Lyman-α forest would only begin around 4145 Å (denoted with dark grey arrows). The insert shows the spatial profile averaged over the wavelength range 4447–4455 Å (solid line, covering the spatially extended emission line, which we interpret as Lyman-α) compared to the continuum profile averaged over the wavelength range 4500–4600 Å.
Current usage metrics show cumulative count of Article Views (full-text article views including HTML views, PDF and ePub downloads, according to the available data) and Abstracts Views on Vision4Press platform.
Data correspond to usage on the plateform after 2015. The current usage metrics is available 48-96 hours after online publication and is updated daily on week days.
Initial download of the metrics may take a while.