Fig. 1.
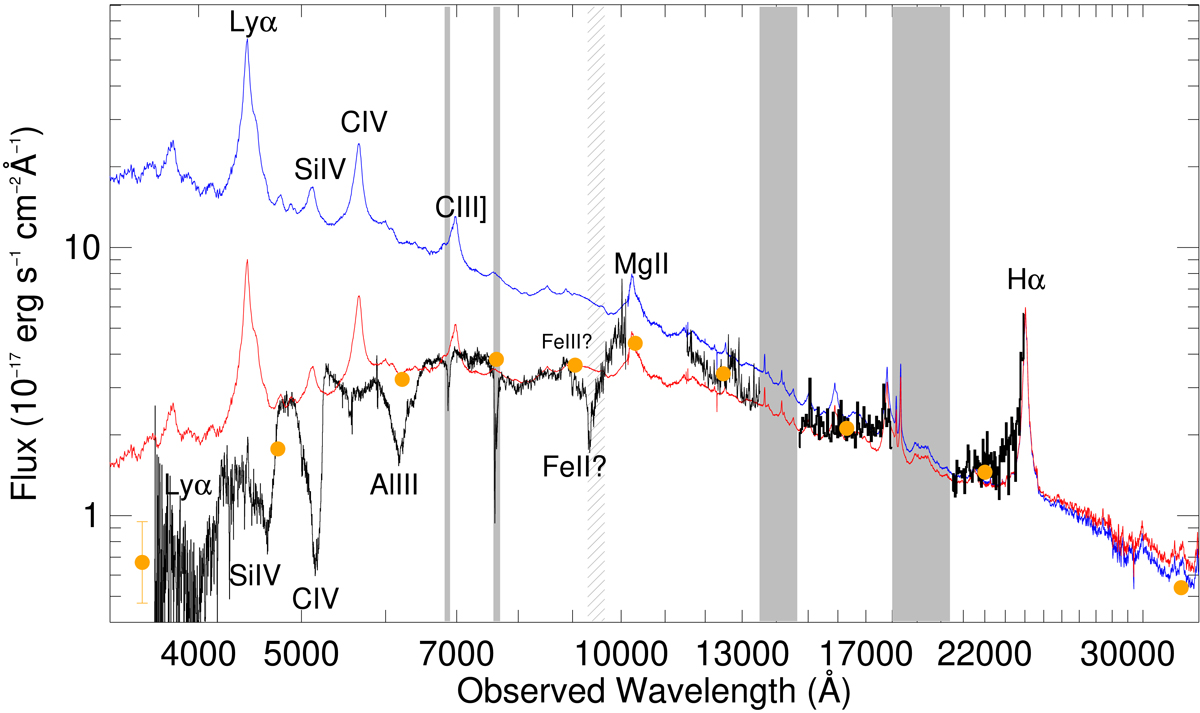
Spectra of GQ 1309+2904 from GTC, NOT, MOSFIRE, and LIRIS are shown together with ugriz, YJHK, and W1 photometry from the SDSS, UKIDSS, and WISE surveys (orange points). The spectra are shown with logarithmic axes to better point out all important details. The shaded areas around 6800 Å and 7600 Å indicate the locations of the telluric A and B absorption bands. A region with many narrow telluric lines at 9300–9650 Å is indicated by shading, which may affect the appearance of, but cannot fully account for, the BALs seen there. The MOSFIRE spectrum is interpolated across skyline residuals for illustration purposes. Except for the u band (where the error is 0.38 mag), the error bars on the photometric data points are smaller than the plotting symbols. Also overplotted are a template quasar spectrum from Selsing et al. (2016) redshifted to z = 2.66 (in blue) and this same spectrum reddened by SMC-like extinction with AB = 0.55 mag (in red).
Current usage metrics show cumulative count of Article Views (full-text article views including HTML views, PDF and ePub downloads, according to the available data) and Abstracts Views on Vision4Press platform.
Data correspond to usage on the plateform after 2015. The current usage metrics is available 48-96 hours after online publication and is updated daily on week days.
Initial download of the metrics may take a while.