Fig. A.1.
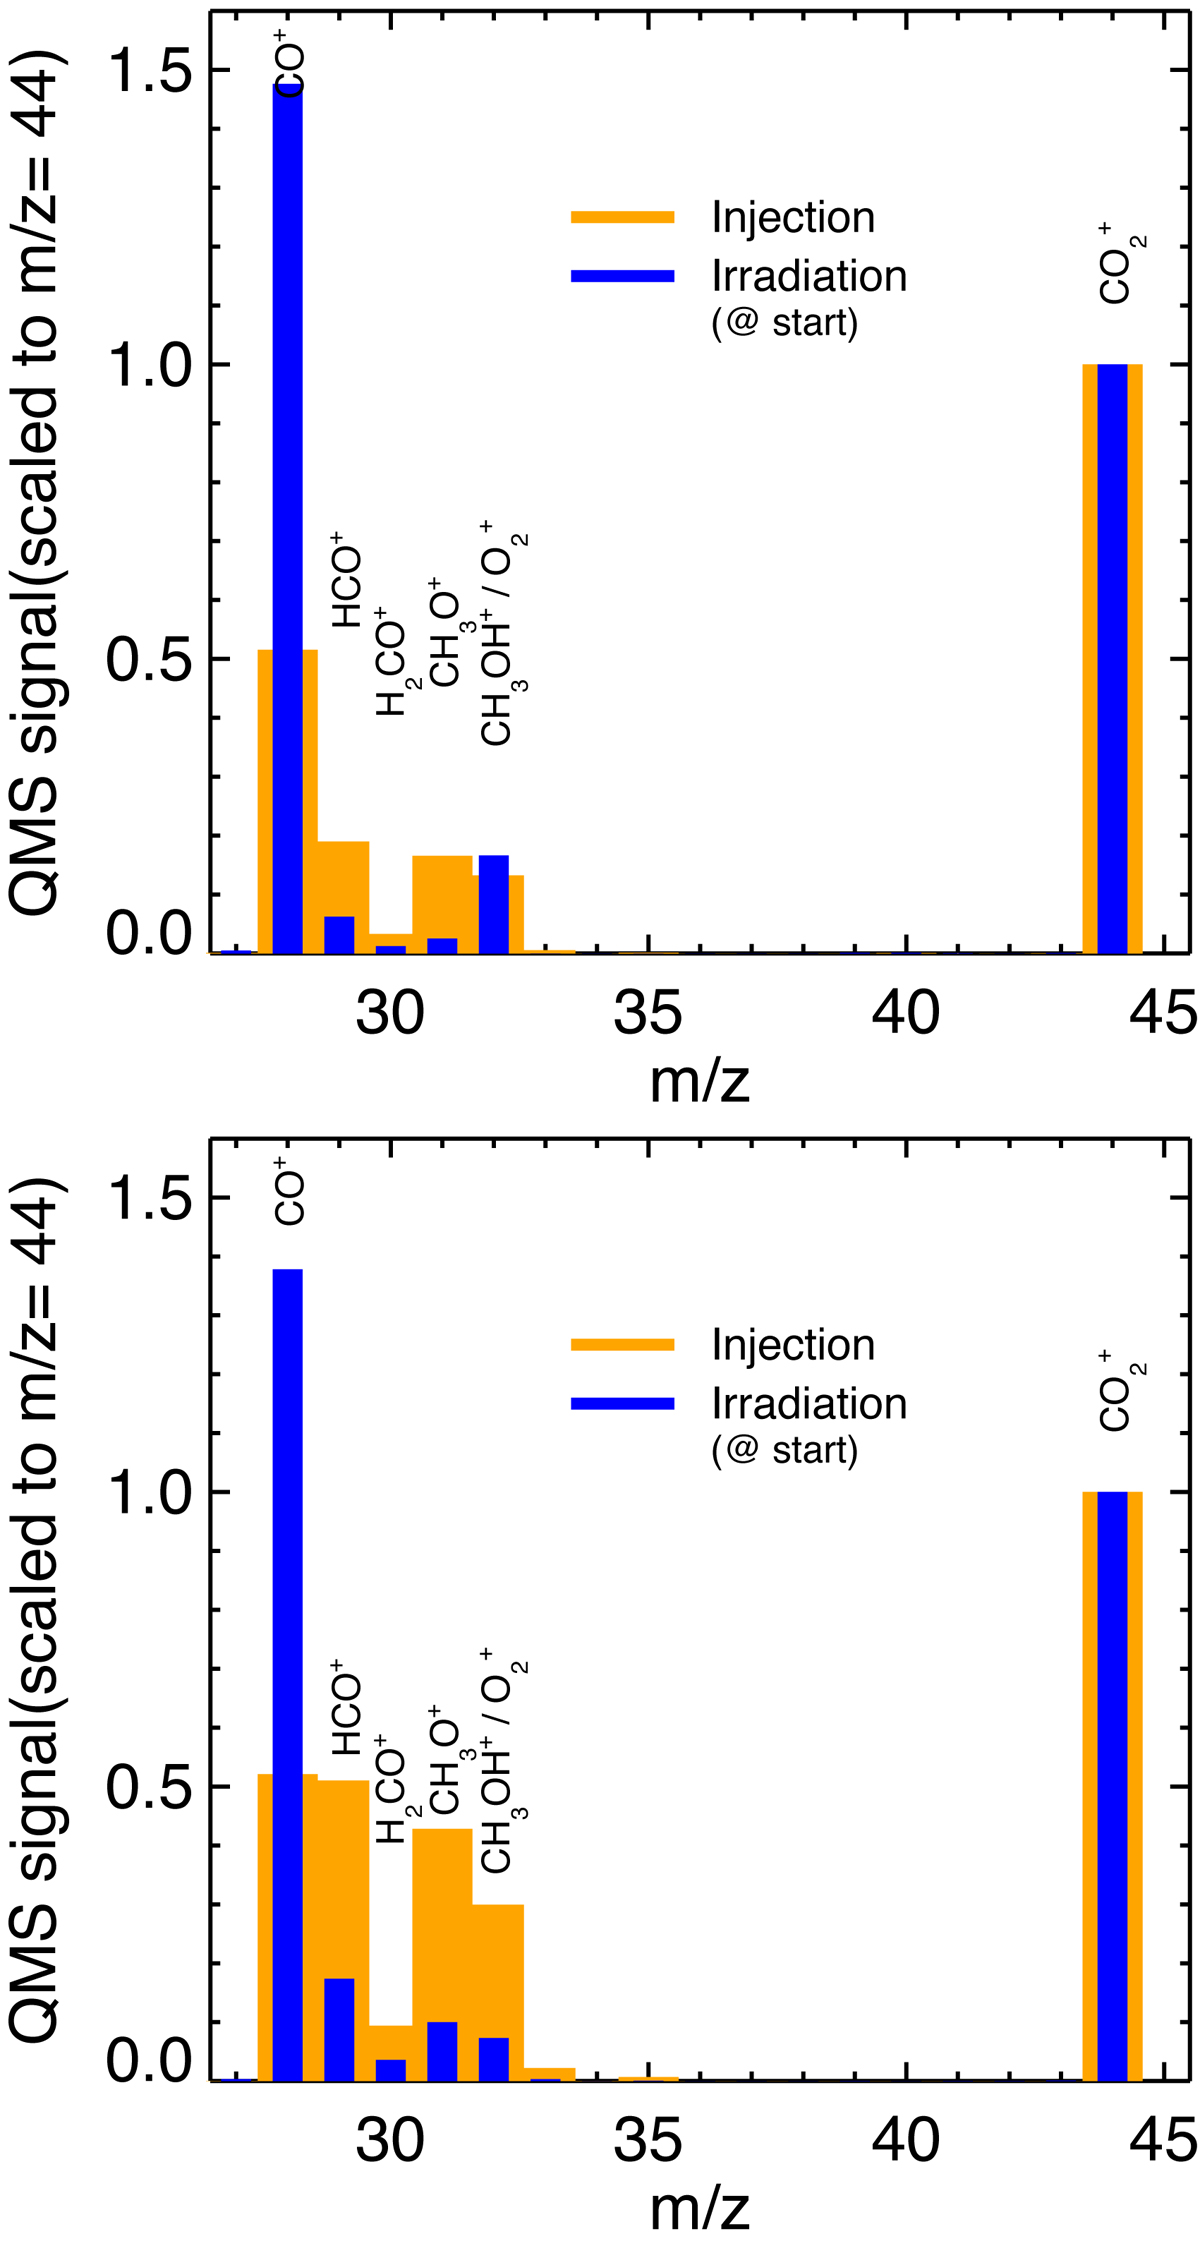
Average of mass spectra recorded during the 12C-methanol and carbon dioxide mixture injection to form the ice film (orange histogram), tracing the QMS mass-fragmentation patterns of pure methanol and carbon dioxide; average of a few spectra that were recorded at the beginning of the ice-film irradiation (blue histogram). Both mass spectra are scaled to m/z = 44 (![]() ) for comparison. From top to bottom: mixtures with increasing proportions of methanol in relation to carbon dioxide. See text for details.
) for comparison. From top to bottom: mixtures with increasing proportions of methanol in relation to carbon dioxide. See text for details.
Current usage metrics show cumulative count of Article Views (full-text article views including HTML views, PDF and ePub downloads, according to the available data) and Abstracts Views on Vision4Press platform.
Data correspond to usage on the plateform after 2015. The current usage metrics is available 48-96 hours after online publication and is updated daily on week days.
Initial download of the metrics may take a while.