Fig. 1.
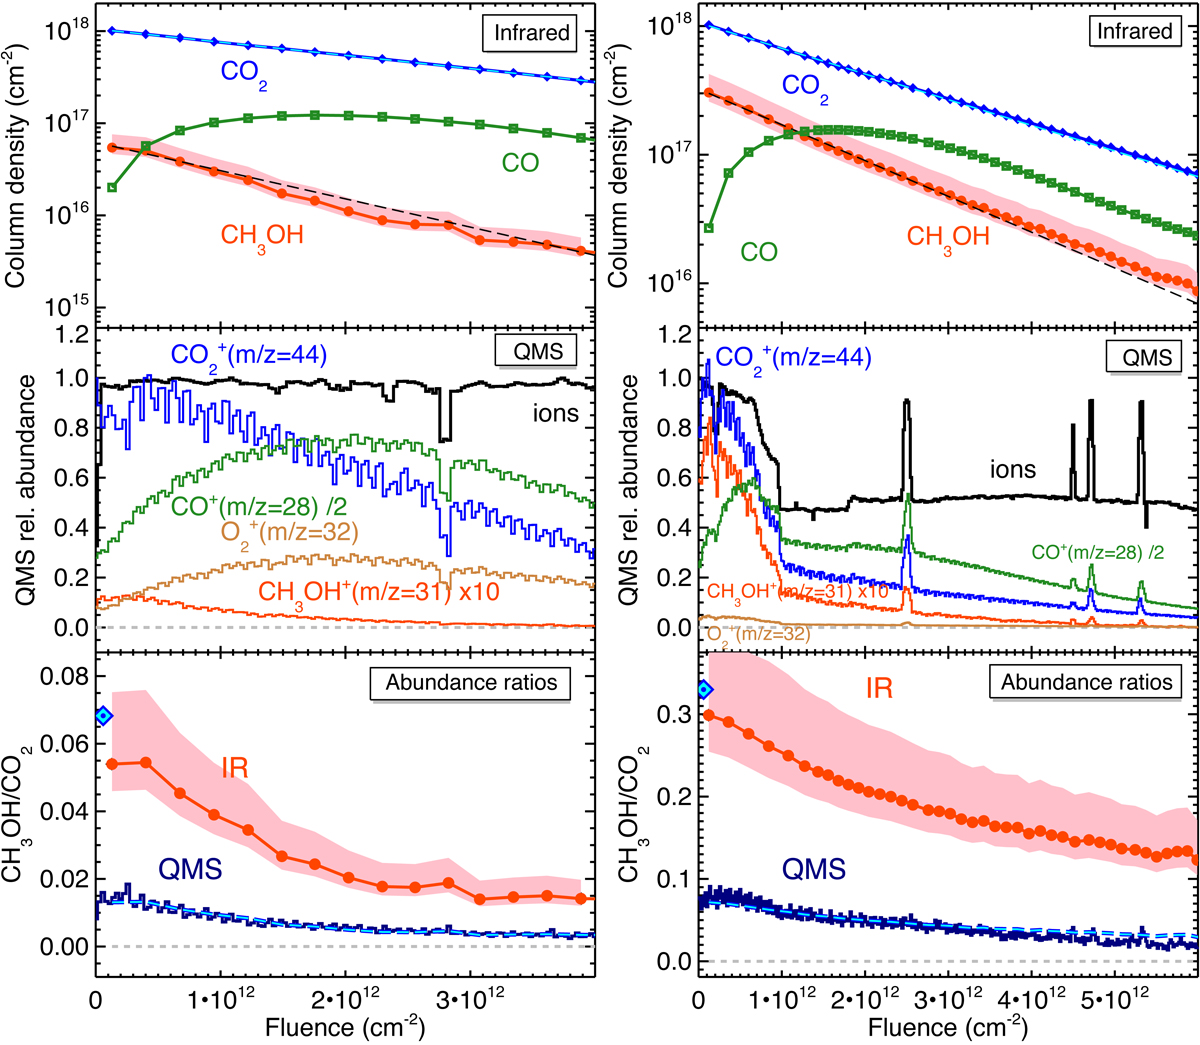
Methanol carbon dioxide ice-film mixture experiments. Left: CH3OH/CO2 (6.8%). Right: CH3OH/CO2 (30.5%). Upper panels: ice column-density measurements from IR spectra. The column densities are estimated using the integrated cross sections from Table B.1. The cyan and black dashed lines represent the fits to the destruction cross section of carbon dioxide and methanol, respectively. Middle panels: QMS-normalised signals used to follow the relative abundance of carbon dioxide (m/z = 44), methanol (m/z = 31; m/z = 32 cannot be used, as it is strongly overlapping with dioxygen), and carbon monoxide (m/z = 28, after subtracting the contribution of the mass fragmentation of CO2) during irradiation. The black line is the scaled monitoring signal of the ion flux, showing its stability. The m/z = 28 signal increases at the beginning, because it contains fragments from the radiolytic products of the ice mixture. Lower panels: CH3OH/CO2 abundance ratio deduced from the IR spectra of the ice film in function of fluence (red dots, uncertainty filled in in red). Comparison with the QMS-determined abundance ratio of the same desorbed molecules (dark blue line, from m/z = 31 for CH3OH and m/z = 44 for CO2). The blue and cyan diamond symbol indicates the gas ratio measurement with the QMS during the ice film deposition. The dashed blue and cyan line represents χ = βmeas × (fCH3OH/fCO2)bulk. See text for details.
Current usage metrics show cumulative count of Article Views (full-text article views including HTML views, PDF and ePub downloads, according to the available data) and Abstracts Views on Vision4Press platform.
Data correspond to usage on the plateform after 2015. The current usage metrics is available 48-96 hours after online publication and is updated daily on week days.
Initial download of the metrics may take a while.