Fig. 7
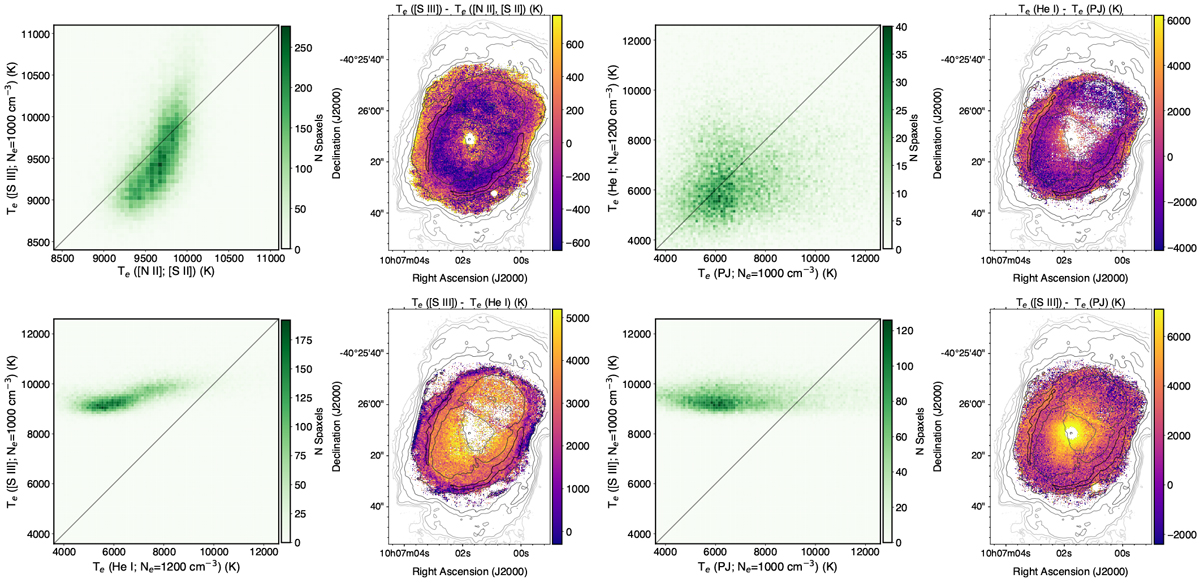
Comparison of the different Te maps. Each subfigure is made of two panels. On the left side, a 2D histogram to compare two different Te maps is presented. The black diagonal signals the locus of equal temperatures. On the right side, there is the map with difference between the ordinate and abscissa axes. The pairs of temperature considered are those involving [S III] and [S II], [N II] (top left), He I and Paschen Jump (top right), [S III] and He I (bottom left), and [S III] and Paschen Jump (bottom right). Te ([O I]) was derived for a much smaller number of spaxels than the other Te maps and not included here.
Current usage metrics show cumulative count of Article Views (full-text article views including HTML views, PDF and ePub downloads, according to the available data) and Abstracts Views on Vision4Press platform.
Data correspond to usage on the plateform after 2015. The current usage metrics is available 48-96 hours after online publication and is updated daily on week days.
Initial download of the metrics may take a while.