Fig. 5
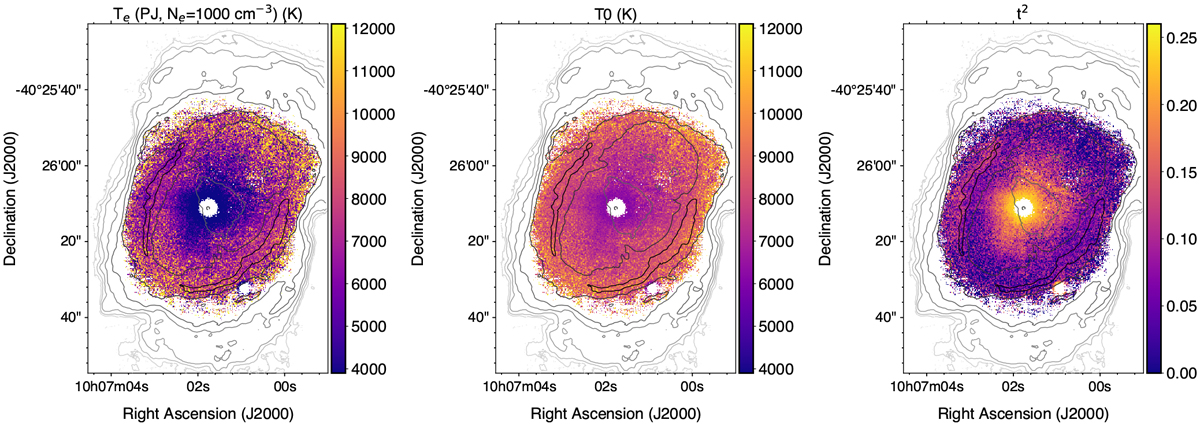
Left: map of Te derived from the magnitude of the Paschen continuum jump at 8250 Å ratioed by the dereddened H I Paschen 11 (8862.8 Å) emission line strength. Initial estimates of Te and Ne from the [S III] and [Cl III] ratio maps were applied; see text for details. Low Te values over the two bright stars in the field (central star and field star to south-west) are produced by the stellar continua mimicking a low Te. Centre: map of the average temperature, T0. Right: map of the temperature fluctuation parameter, t2. Both were determined from the map presented in the left column and the Te ([S III]) map shown in Fig. 4.
Current usage metrics show cumulative count of Article Views (full-text article views including HTML views, PDF and ePub downloads, according to the available data) and Abstracts Views on Vision4Press platform.
Data correspond to usage on the plateform after 2015. The current usage metrics is available 48-96 hours after online publication and is updated daily on week days.
Initial download of the metrics may take a while.