Fig. 15
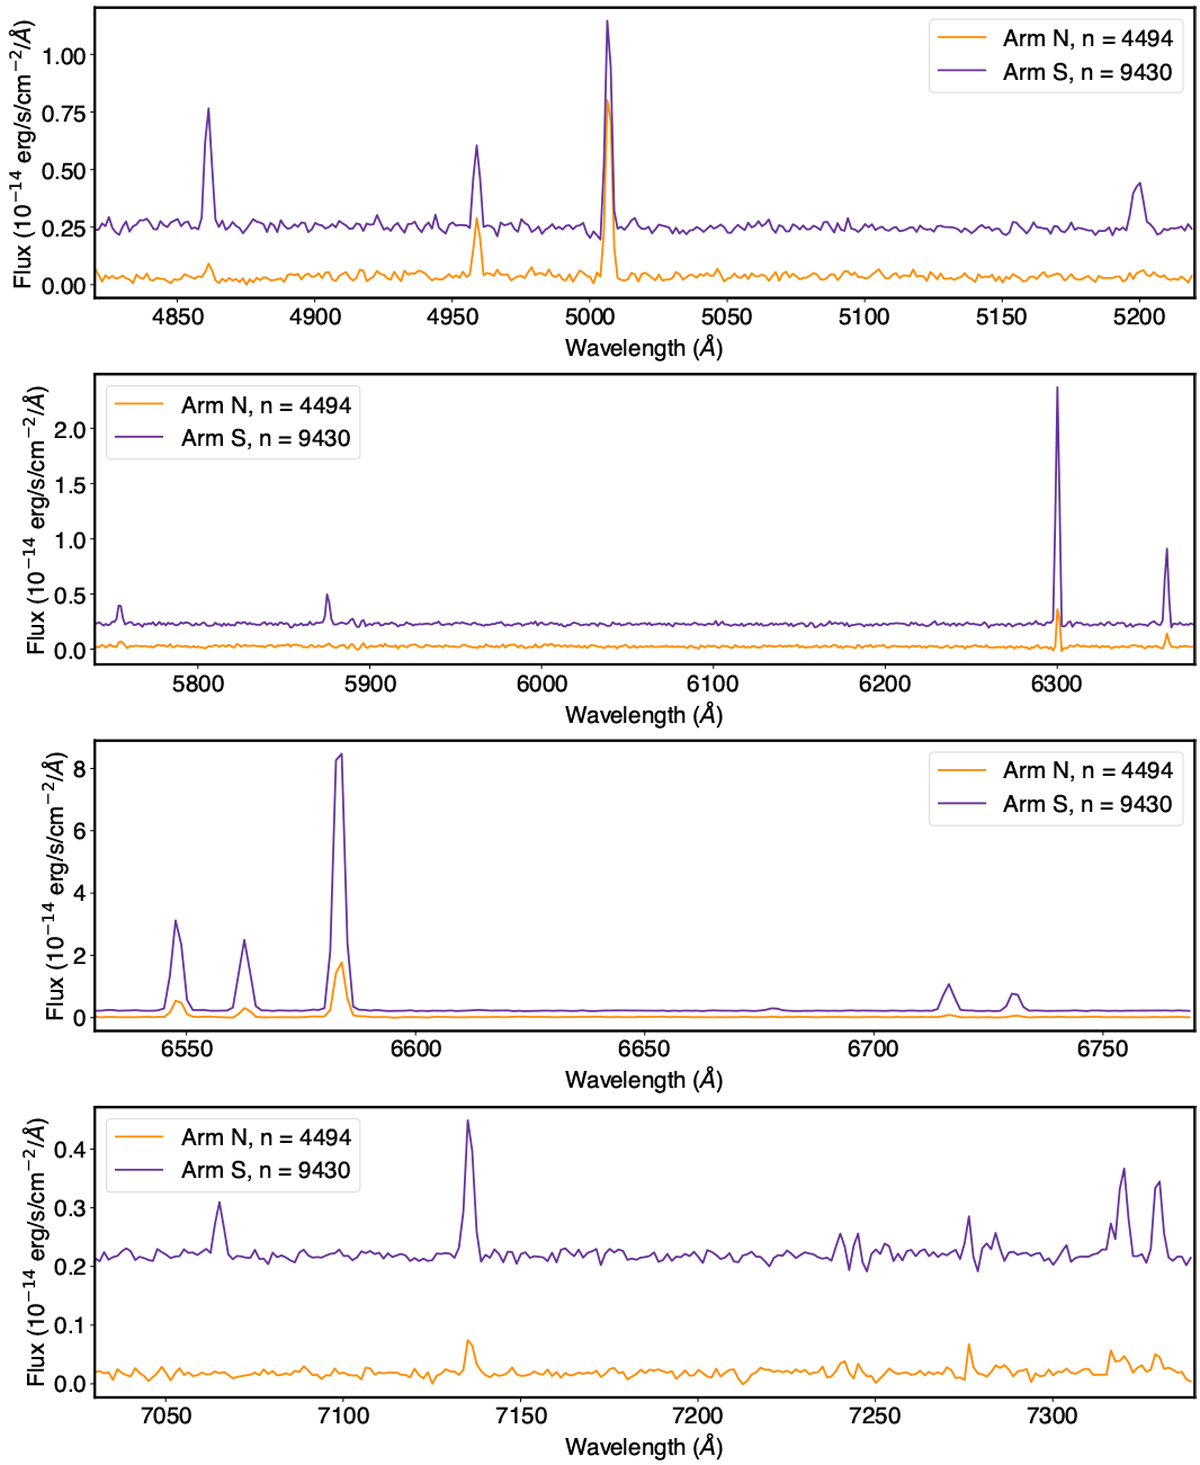
Selected spectral ranges showing the emission lines detected in the northern (orange) and southern (violet) LIS. Additionally, [S III] λ9069 (not shown)was the only emission line detected in the reddest part of the MUSE spectral range. To improve visibility, we applied an offset of 0.2 in the y axis to the spectrum of the southern arm.
Current usage metrics show cumulative count of Article Views (full-text article views including HTML views, PDF and ePub downloads, according to the available data) and Abstracts Views on Vision4Press platform.
Data correspond to usage on the plateform after 2015. The current usage metrics is available 48-96 hours after online publication and is updated daily on week days.
Initial download of the metrics may take a while.