Fig. 10
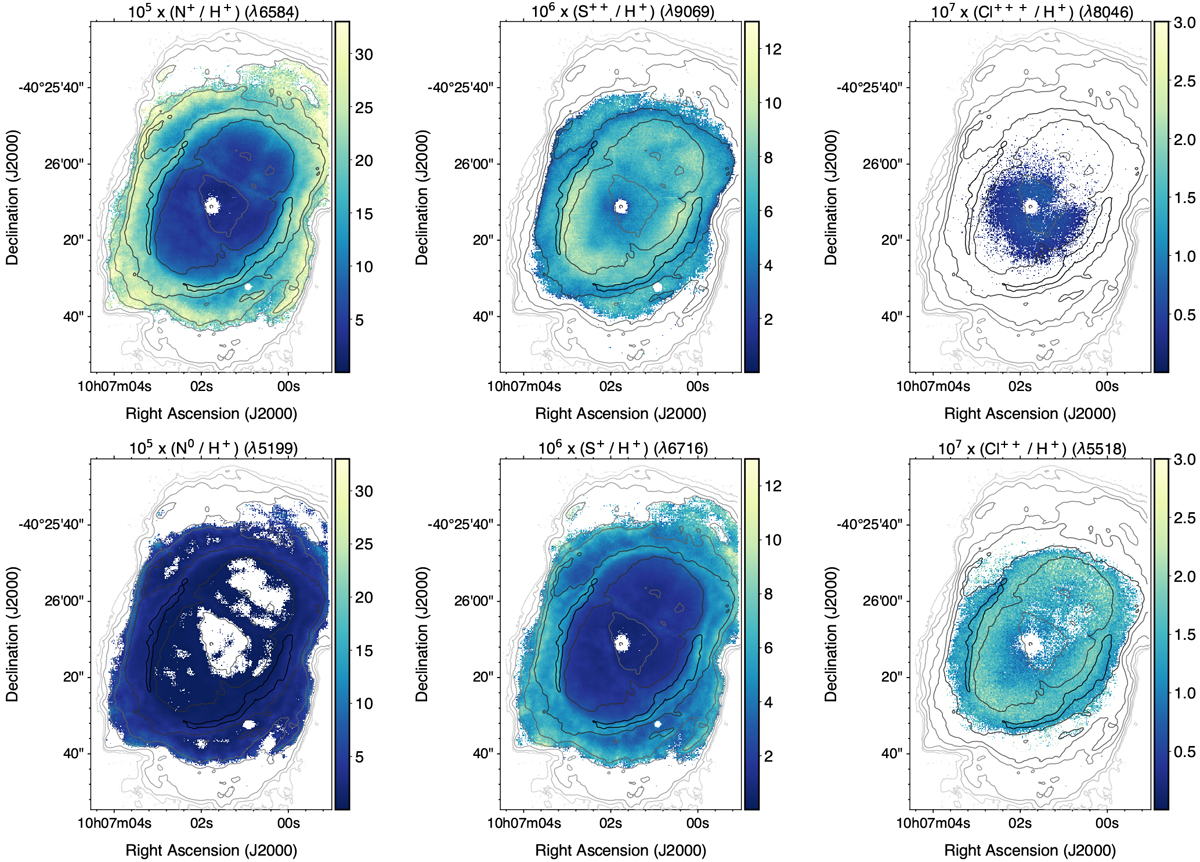
Maps for the ionic abundances of nitrogen (left), sulphur (centre), and chlorine (right). There are two maps tracing different ions for each element, with the more ionised one presented in the upper row. For a given element, both maps display the same range in abundance in order to emphasise the relative contribution of each ion in the different parts of the nebula.
Current usage metrics show cumulative count of Article Views (full-text article views including HTML views, PDF and ePub downloads, according to the available data) and Abstracts Views on Vision4Press platform.
Data correspond to usage on the plateform after 2015. The current usage metrics is available 48-96 hours after online publication and is updated daily on week days.
Initial download of the metrics may take a while.