Fig. 1
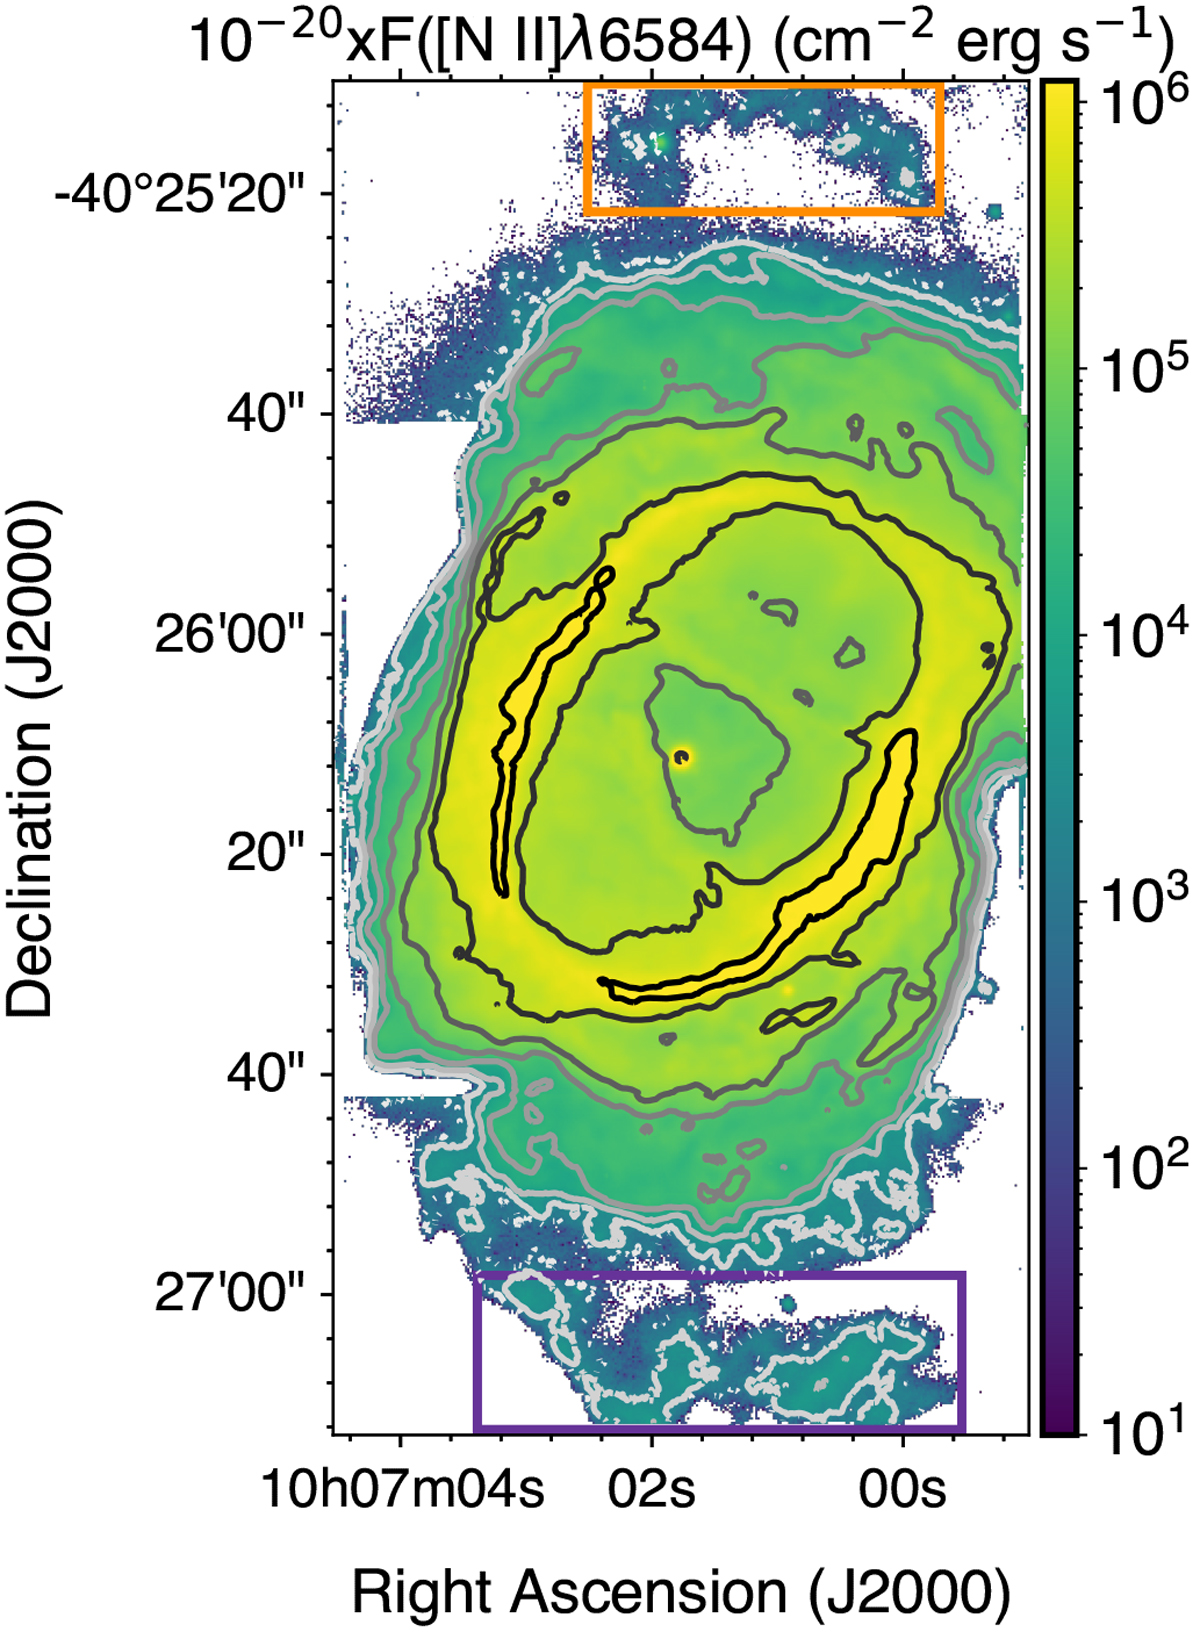
Reconstructed image of NGC 3132 in the [N II]λ6584 emission line, made by simulating the action of a narrow filter (see main text for details). The orange and violet rectangles mark the area used to extract the spectra of the newly detected northern and southern arcs (see Sects. 3 and 9). Here, and in forthcoming maps, this image willbe presented for reference with ten evenly spaced contours (in logarithmic scale), ranging from 1 × 10⁻¹⁸ erg cm−2 s−1 (white) to 1 × 10⁻¹⁴ erg cm−2 s−1 (black).
Current usage metrics show cumulative count of Article Views (full-text article views including HTML views, PDF and ePub downloads, according to the available data) and Abstracts Views on Vision4Press platform.
Data correspond to usage on the plateform after 2015. The current usage metrics is available 48-96 hours after online publication and is updated daily on week days.
Initial download of the metrics may take a while.