Fig. 8.
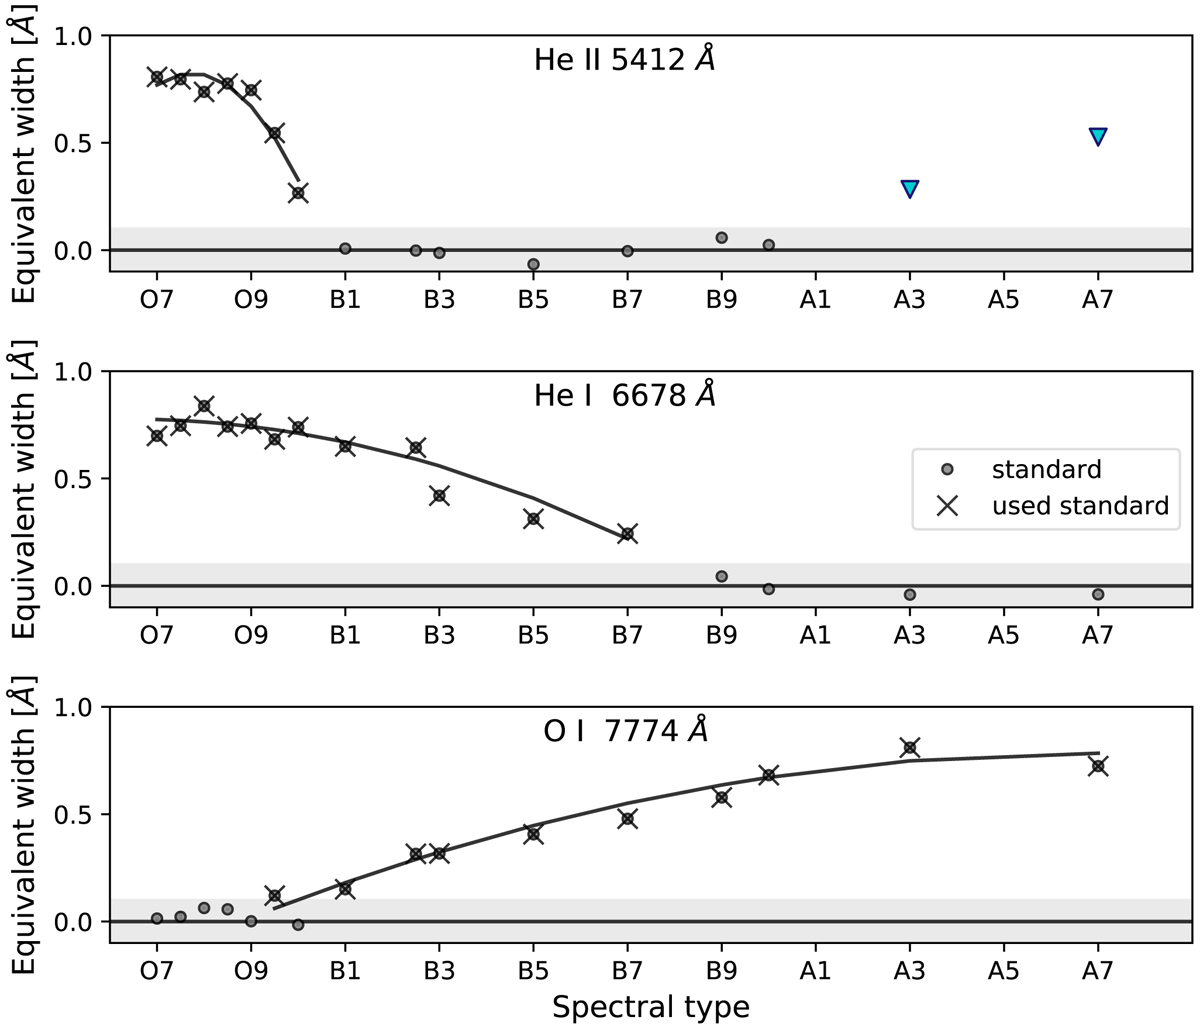
From top to bottom: correlation between the EW measured in the standard star spectra and their spectral type for He II λ 5412, He I λ 6678, and the O I triplet at λ 7774. Black dots show the measured values, and black crosses indicate the data points used to fit the polynomial. EW measurements below 0.1 Å (shaded region around the black line at 0 Å) do not allow a significant detection of spectral lines from noise in the continuum and are therefore excluded from the fit. In the special case of the He II line, the EWs at late spectral types (A5 and later), which are contaminated by metallic lines and thus were not considered in the fit, are indicated by blue triangles.
Current usage metrics show cumulative count of Article Views (full-text article views including HTML views, PDF and ePub downloads, according to the available data) and Abstracts Views on Vision4Press platform.
Data correspond to usage on the plateform after 2015. The current usage metrics is available 48-96 hours after online publication and is updated daily on week days.
Initial download of the metrics may take a while.