Free Access
Fig. 7.
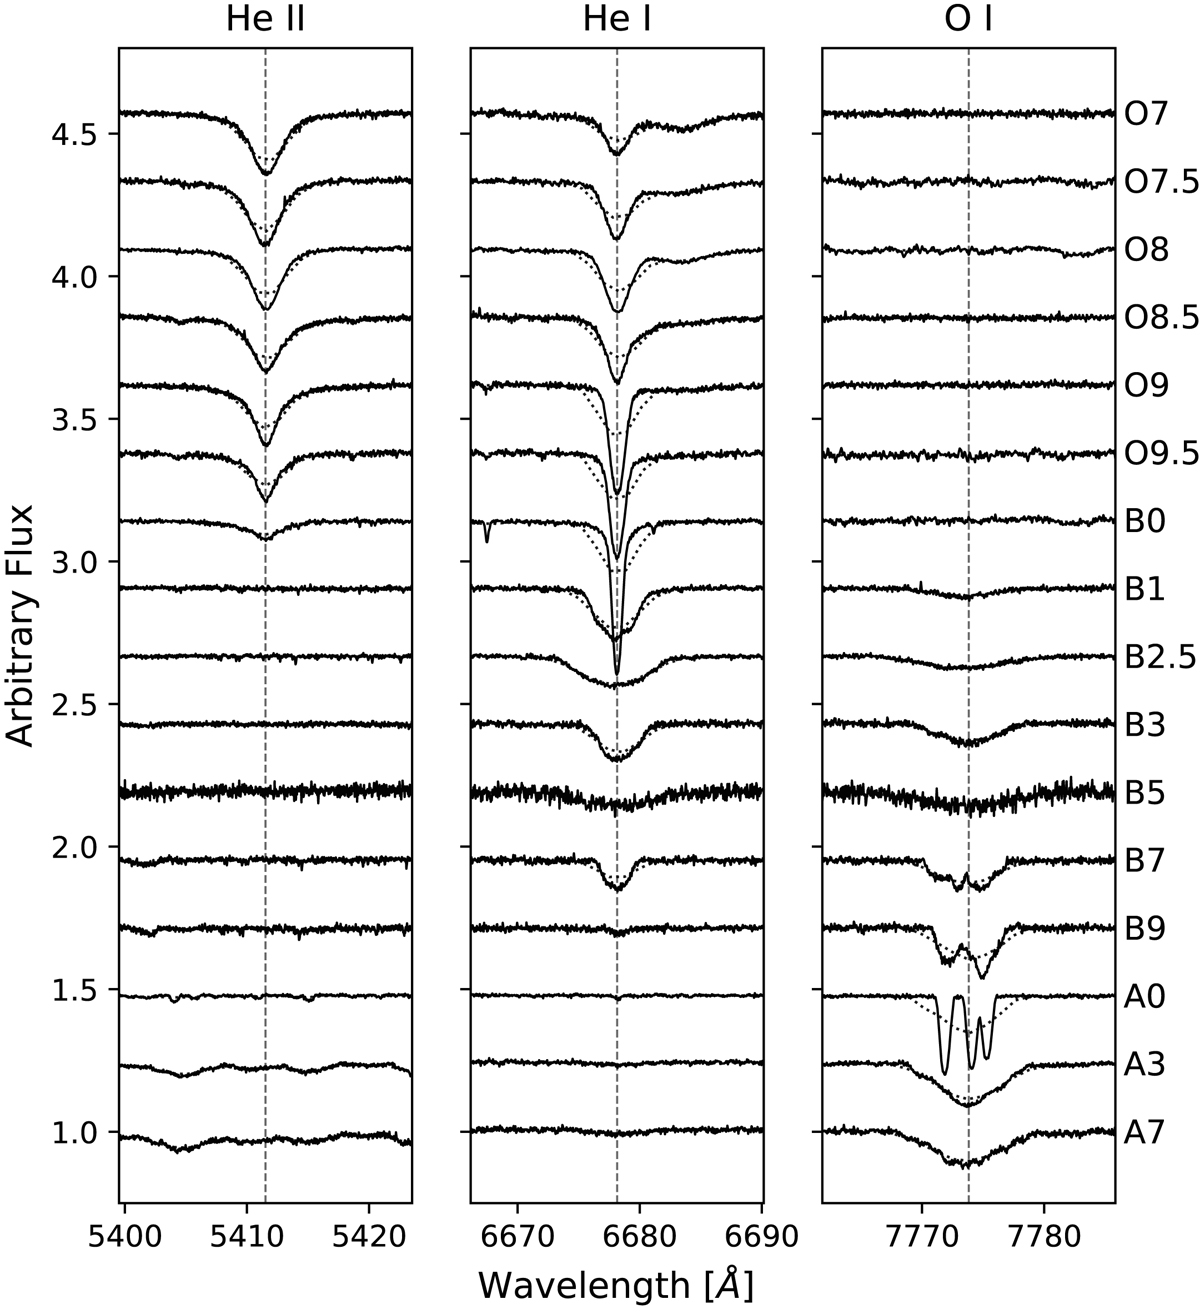
Atlas of spectral standards listed in Table 1 around the three lines of interest. The spectra are shifted horizontally according to the radial velocity and vertically for clarity. The black line shows the original spectra, and the dotted line indicates the spectra degraded to MUSE resolution.
Current usage metrics show cumulative count of Article Views (full-text article views including HTML views, PDF and ePub downloads, according to the available data) and Abstracts Views on Vision4Press platform.
Data correspond to usage on the plateform after 2015. The current usage metrics is available 48-96 hours after online publication and is updated daily on week days.
Initial download of the metrics may take a while.