Fig. 5.
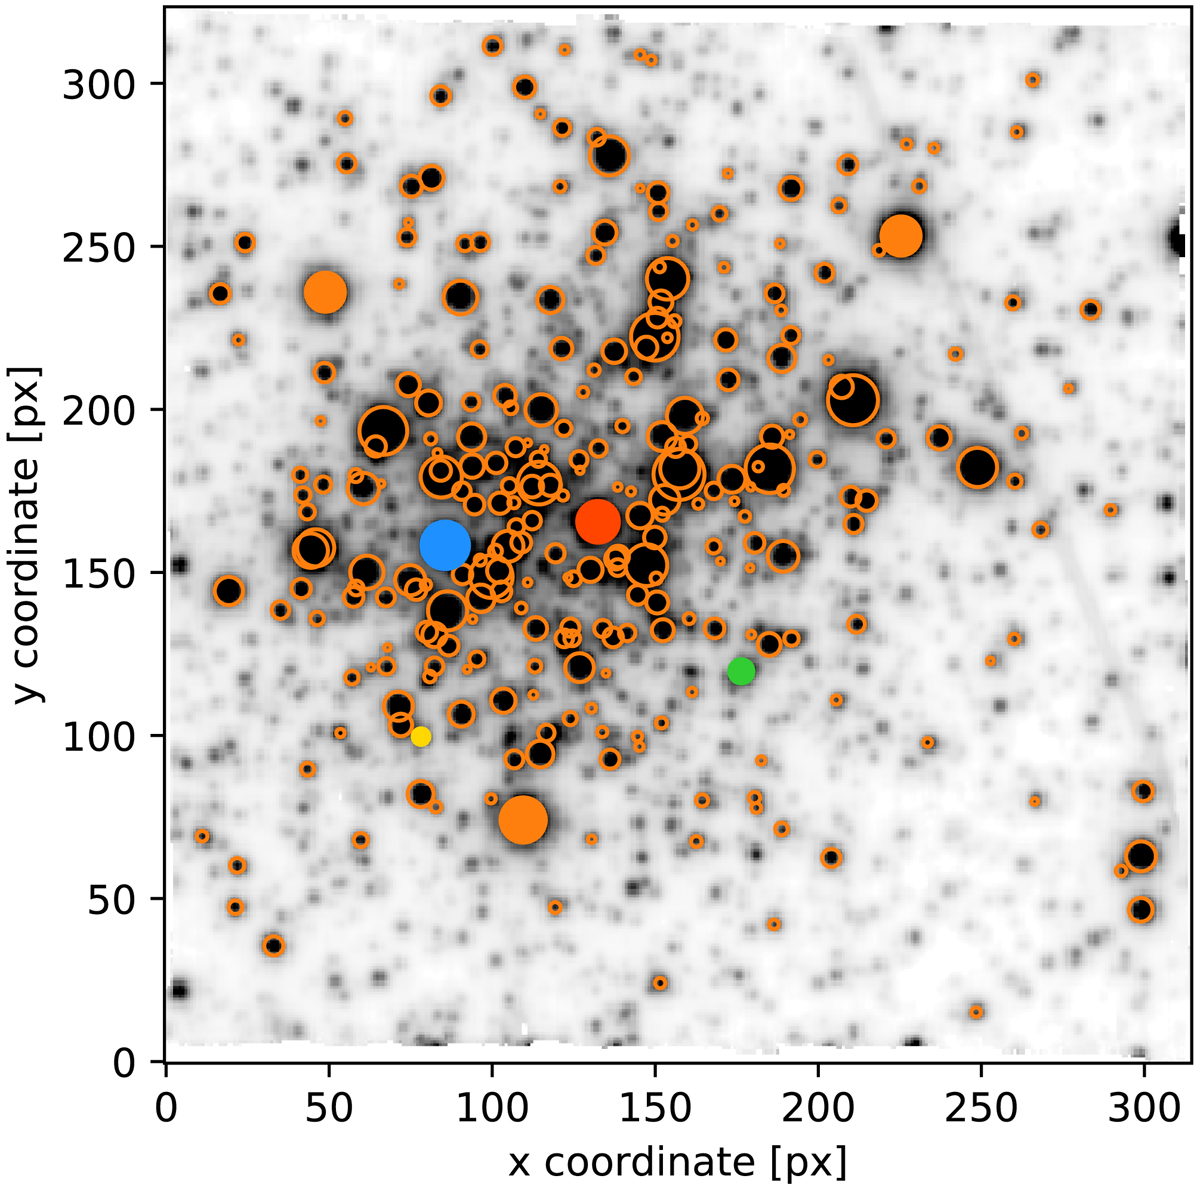
Stars contained in the final target list (i.e., stars brigther than 18.5 in F555W) are overplotted in orange over the MUSE white-light image. The size of the circle corresponds to their inferred brightness in the V band. The stars marked with orange filled circles are used to fit the PSF (see Sect. 3.2). The spectra of the stars marked with red, blue, green, and yellow filled circles are shown in Fig. 6.
Current usage metrics show cumulative count of Article Views (full-text article views including HTML views, PDF and ePub downloads, according to the available data) and Abstracts Views on Vision4Press platform.
Data correspond to usage on the plateform after 2015. The current usage metrics is available 48-96 hours after online publication and is updated daily on week days.
Initial download of the metrics may take a while.