Fig. B.1.
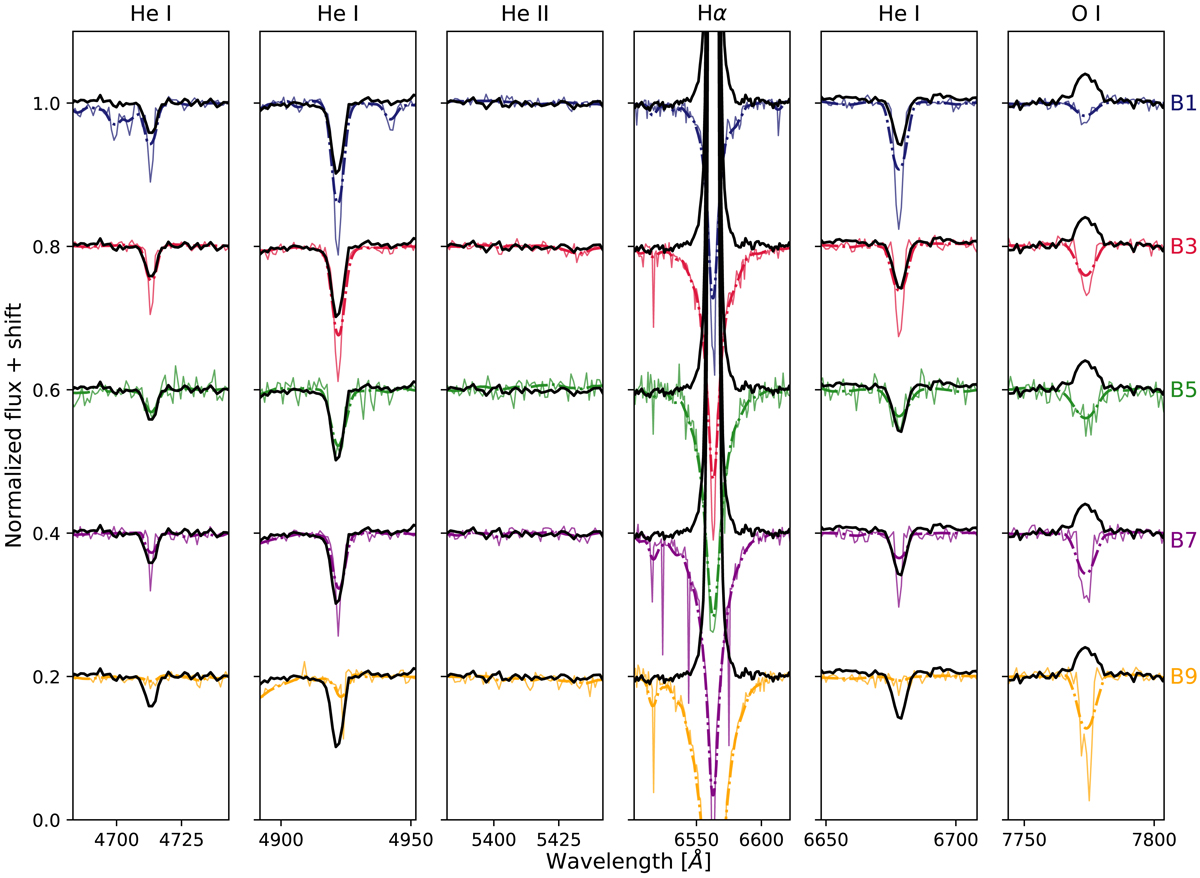
Example Be star spectral classification of star 290. The MUSE spectrum of the star that has to be classified is shown in black. Overplotted and shifted vertically for clarity are a set of standard star spectra (as described in Sect. 4.1) of spectral types B1 to B9, degraded to the MUSE resolution. While the continuous line shows the observed standard star spectrum, the dash-dotted line is rotationally broadened by 200 km s−1.
Current usage metrics show cumulative count of Article Views (full-text article views including HTML views, PDF and ePub downloads, according to the available data) and Abstracts Views on Vision4Press platform.
Data correspond to usage on the plateform after 2015. The current usage metrics is available 48-96 hours after online publication and is updated daily on week days.
Initial download of the metrics may take a while.