Free Access
Fig. 18.
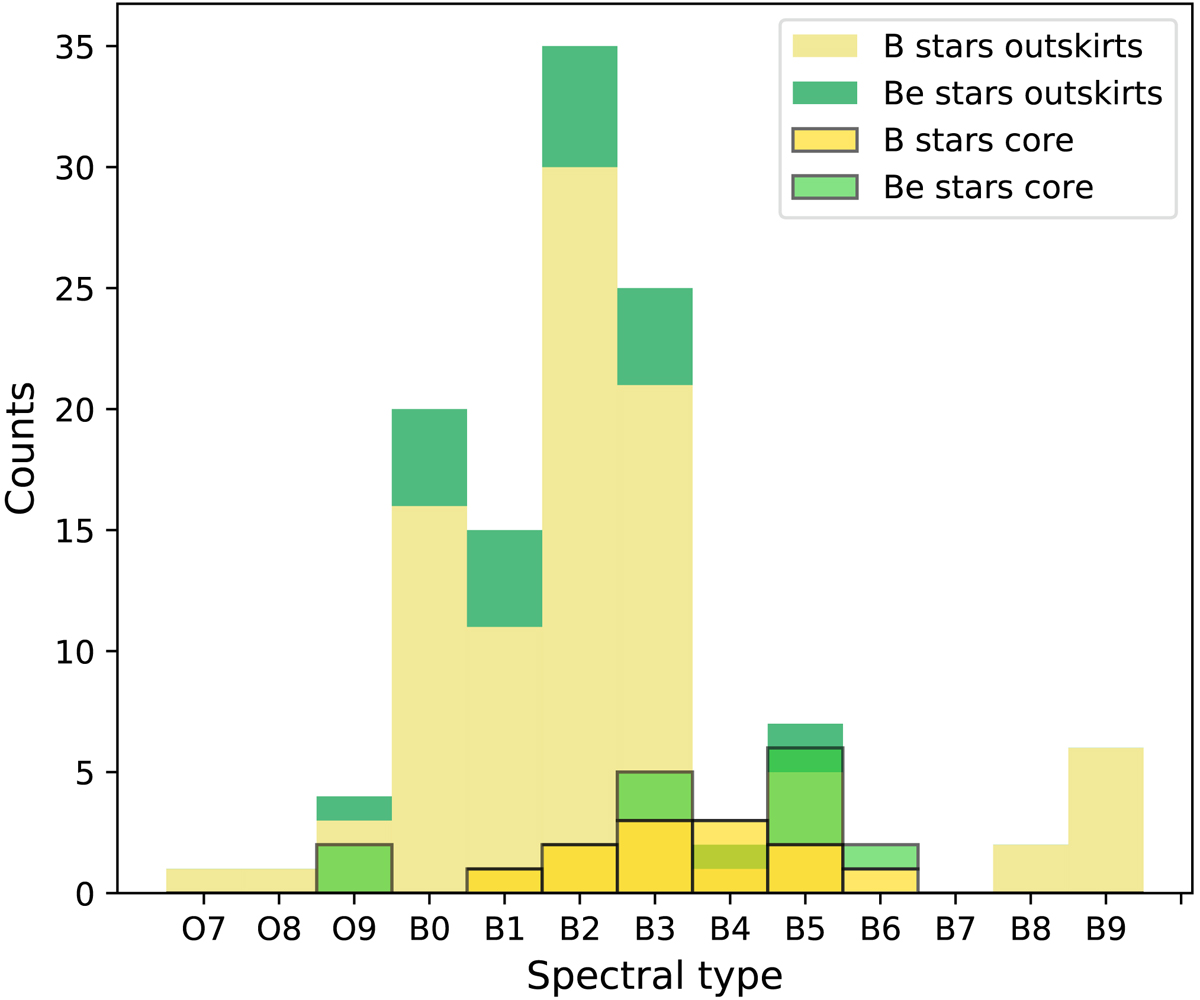
Distribution of spectral types from Evans et al. (2006, outskirts) compared to the MUSE data (see Fig. 14) of the core. The sample of Evans et al. contains no stars fainter than V = 17, therefore we cut our sample at this brightness to facilitate the comparison.
Current usage metrics show cumulative count of Article Views (full-text article views including HTML views, PDF and ePub downloads, according to the available data) and Abstracts Views on Vision4Press platform.
Data correspond to usage on the plateform after 2015. The current usage metrics is available 48-96 hours after online publication and is updated daily on week days.
Initial download of the metrics may take a while.