Fig. 16.
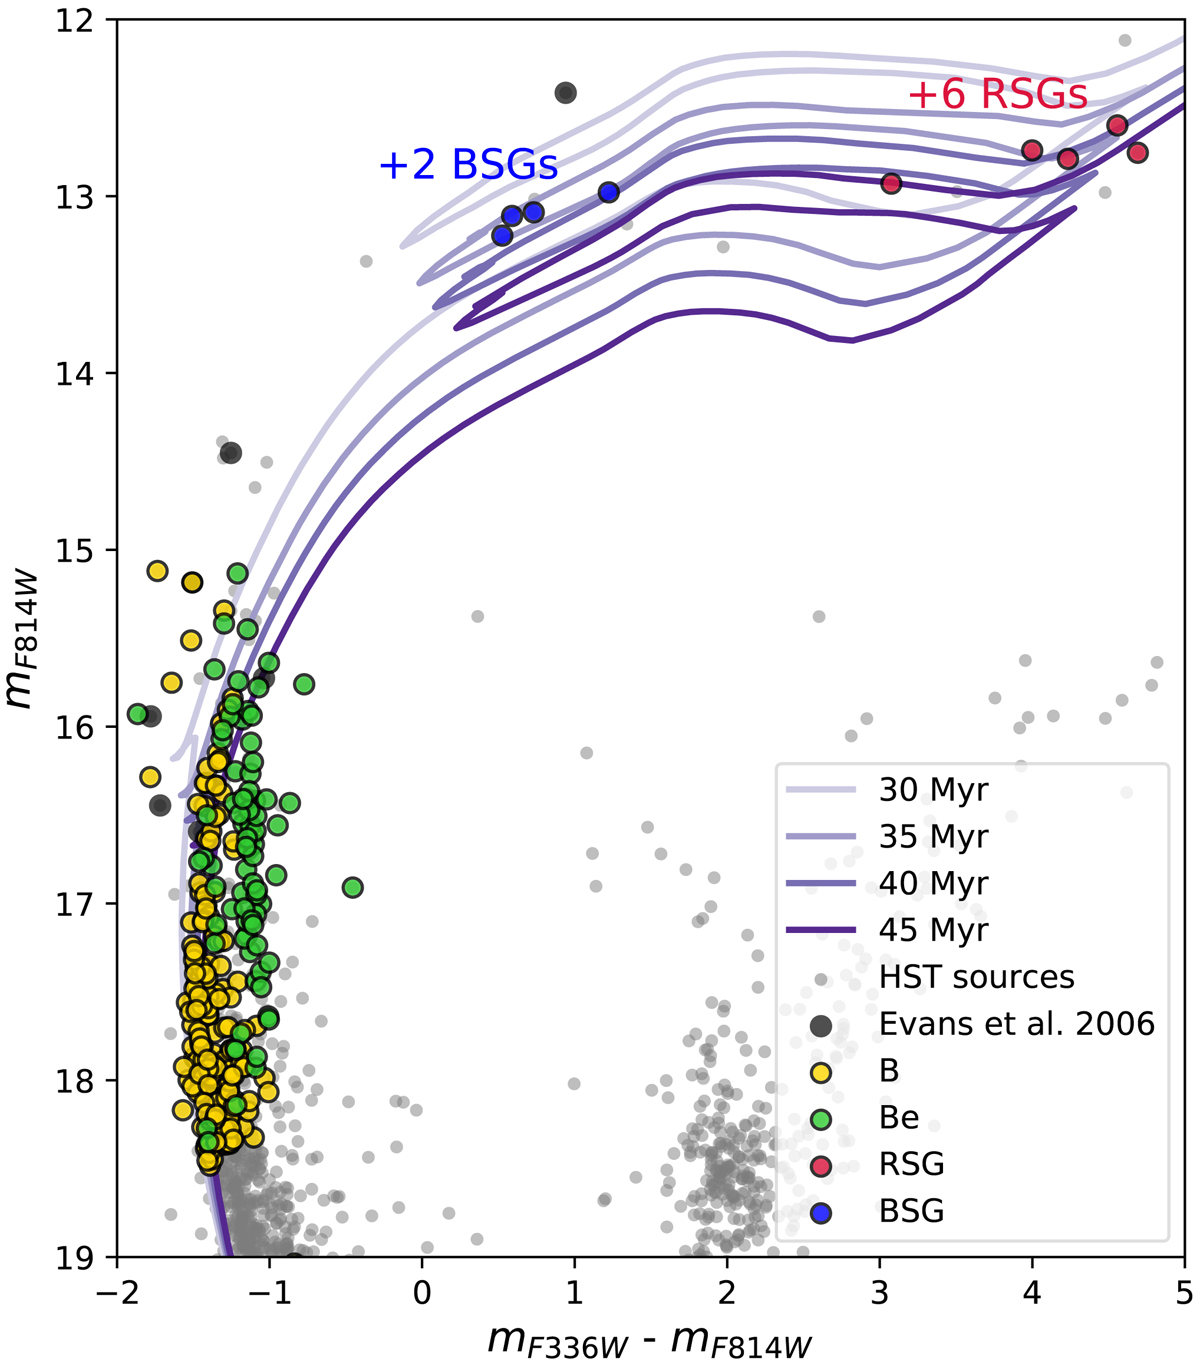
Reconstructed CMD from Milone et al. (2018), where their complete input catalog containing field and cluster stars (see their Fig. 2) is shown in gray. The sources with available MUSE spectra are colored in terms of the spectral type we derived from the MUSE data, that is, Be stars in green, B stars in yellow, RSGs in red, and BSGs in blue. The eight sources studied by Evans et al. (2006) that are included in the HST data are indicated with black circles. Overplotted are single-star nonrotating Padova evolutionary tracks for ages between 30 and 45 Myr. Two A-type supergiants and six RSGs are missing in the HST catalog and thus cannot be included in this diagram.
Current usage metrics show cumulative count of Article Views (full-text article views including HTML views, PDF and ePub downloads, according to the available data) and Abstracts Views on Vision4Press platform.
Data correspond to usage on the plateform after 2015. The current usage metrics is available 48-96 hours after online publication and is updated daily on week days.
Initial download of the metrics may take a while.