Fig. 7.
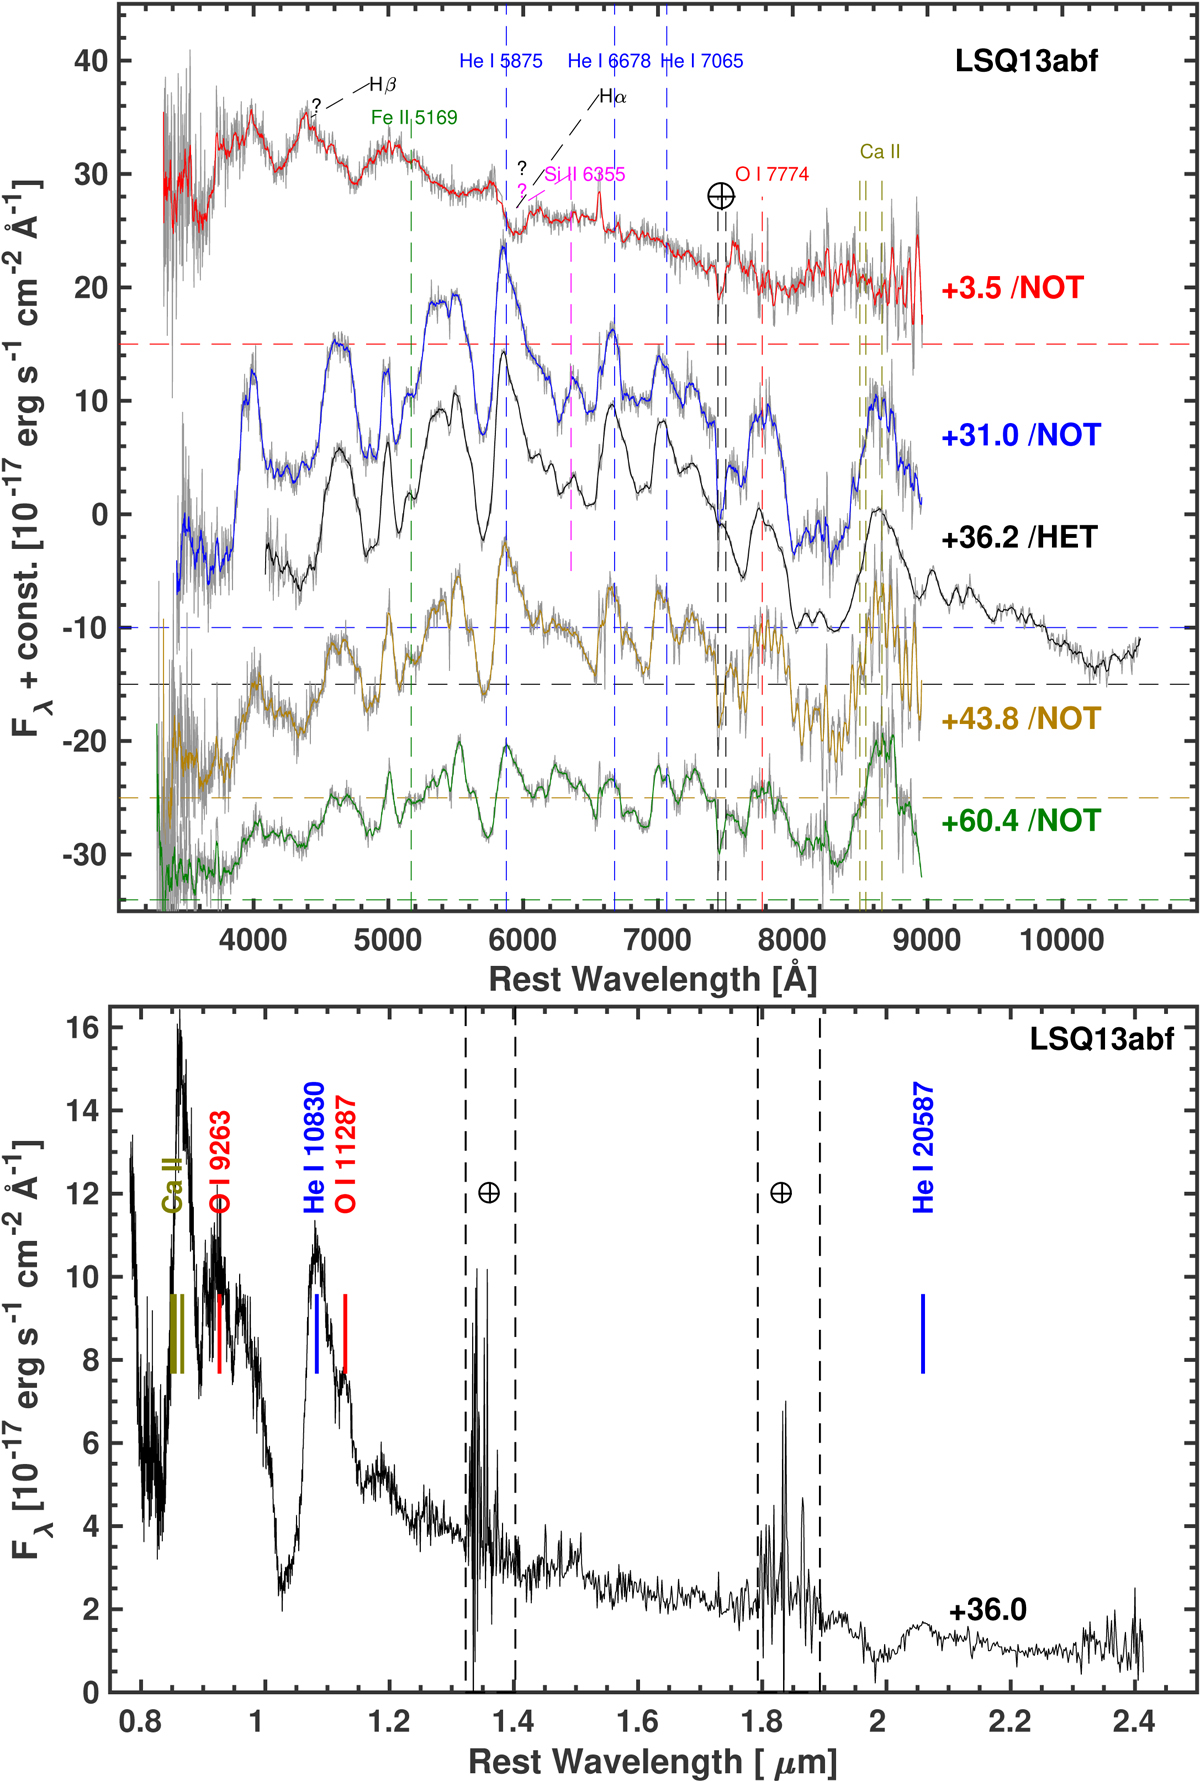
Top: spectral sequence of LSQ13abf. Each visual-wavelength spectrum was scaled to an absolute flux level using the r-band photometry and are shown at rest wavelength. Reported next to each spectrum is its phase (rest-frame days from explosion epoch) and telescope used to make the observation. The zero-flux level for each spectrum is marked by a horizontal dashed line having the same color of the smoothed spectrum. The main spectral features at their rest wavelength are marked by vertical dashed lines and labeled. For the first spectrum, we report uncertain identifications with question marks and dashed lines pointing to the corresponding features. Bottom: NIR spectrum of LSQ13abf taken 36 days post explosion. Prominent spectral features and telluric regions are marked. The spectrum was absolute-flux calibrated using the coeval optical spectrum.
Current usage metrics show cumulative count of Article Views (full-text article views including HTML views, PDF and ePub downloads, according to the available data) and Abstracts Views on Vision4Press platform.
Data correspond to usage on the plateform after 2015. The current usage metrics is available 48-96 hours after online publication and is updated daily on week days.
Initial download of the metrics may take a while.